From an epidemiological line list to informing decisions in real-time
Rt estimation and nowcasting for infectious disease dynamics
“We were losing ourselves in details […] all we needed to know is, are the number of cases rising, falling or levelling off?”
Hans Rosling, Liberia, 2014
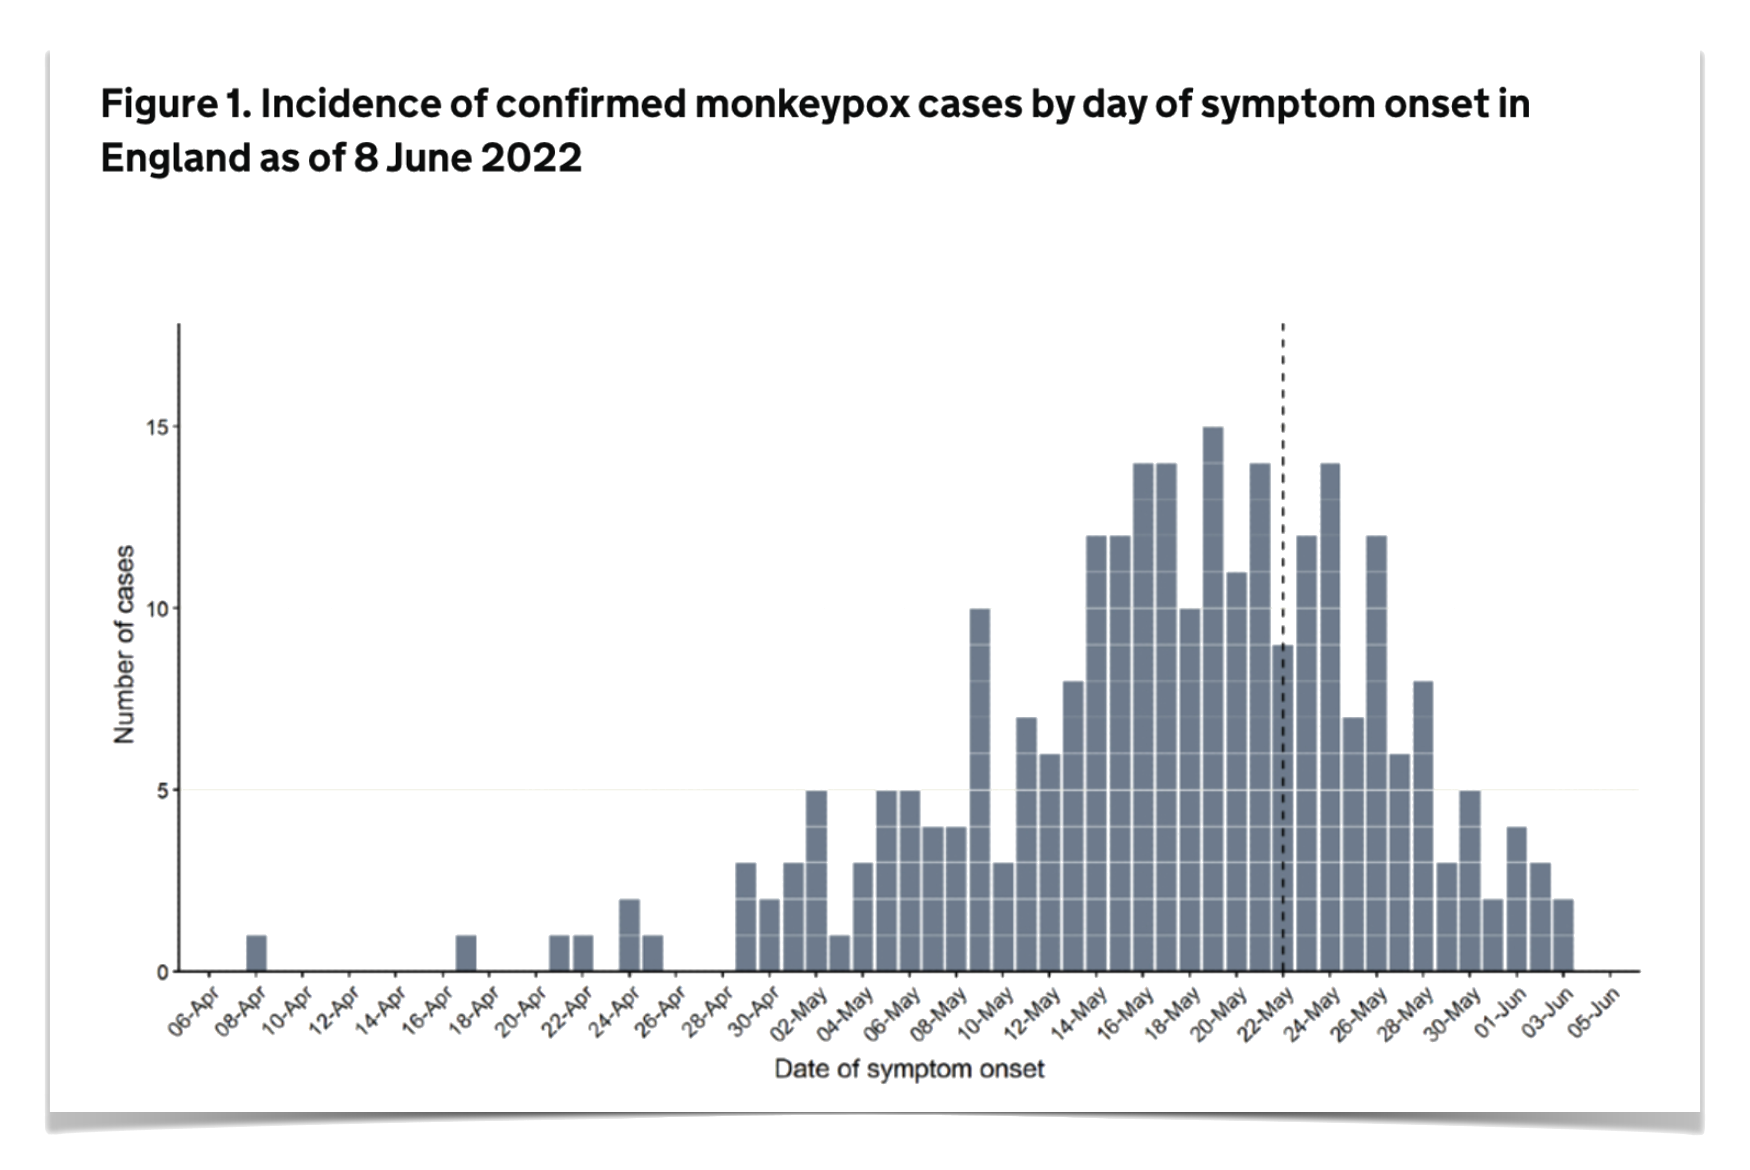
- what is the number of cases now?
- is it rising/falling and by how much?
- how can we estimate both in real time?
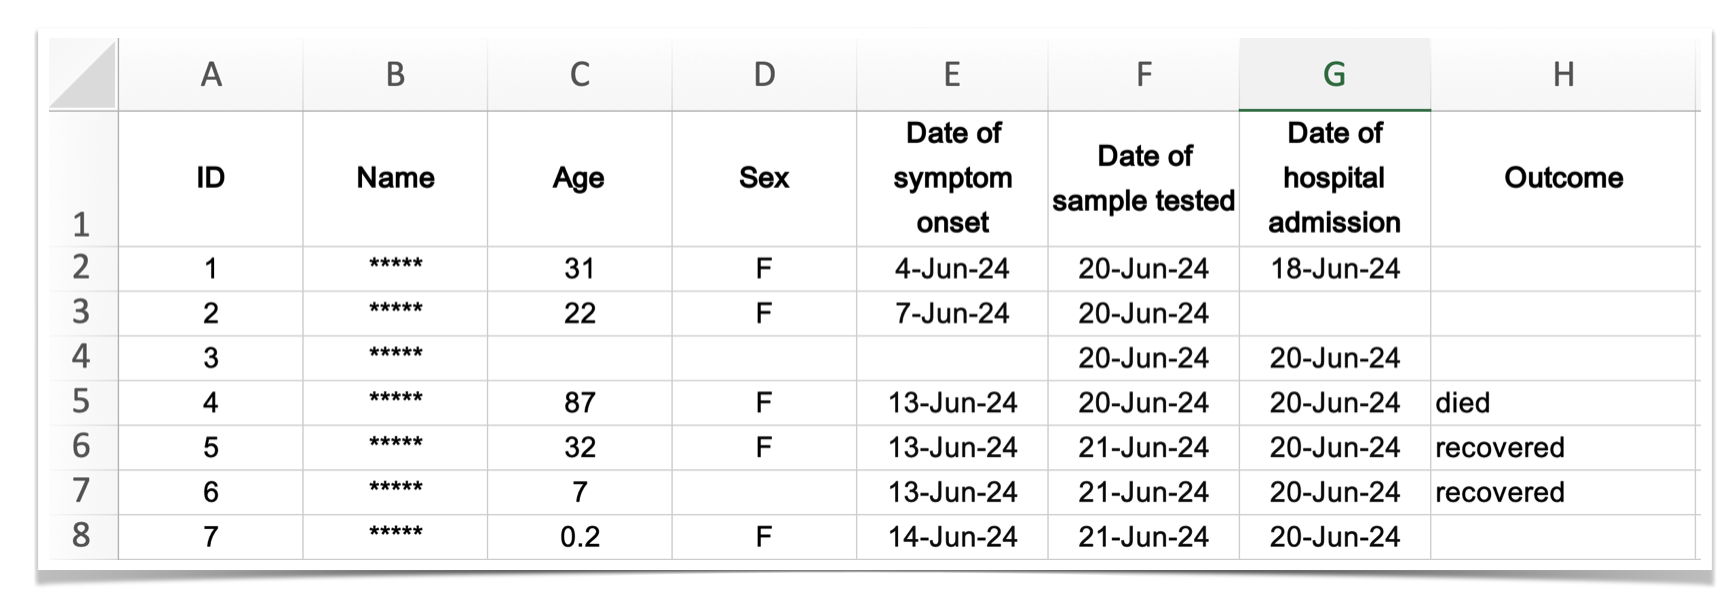
Data usually looks like this
![]()
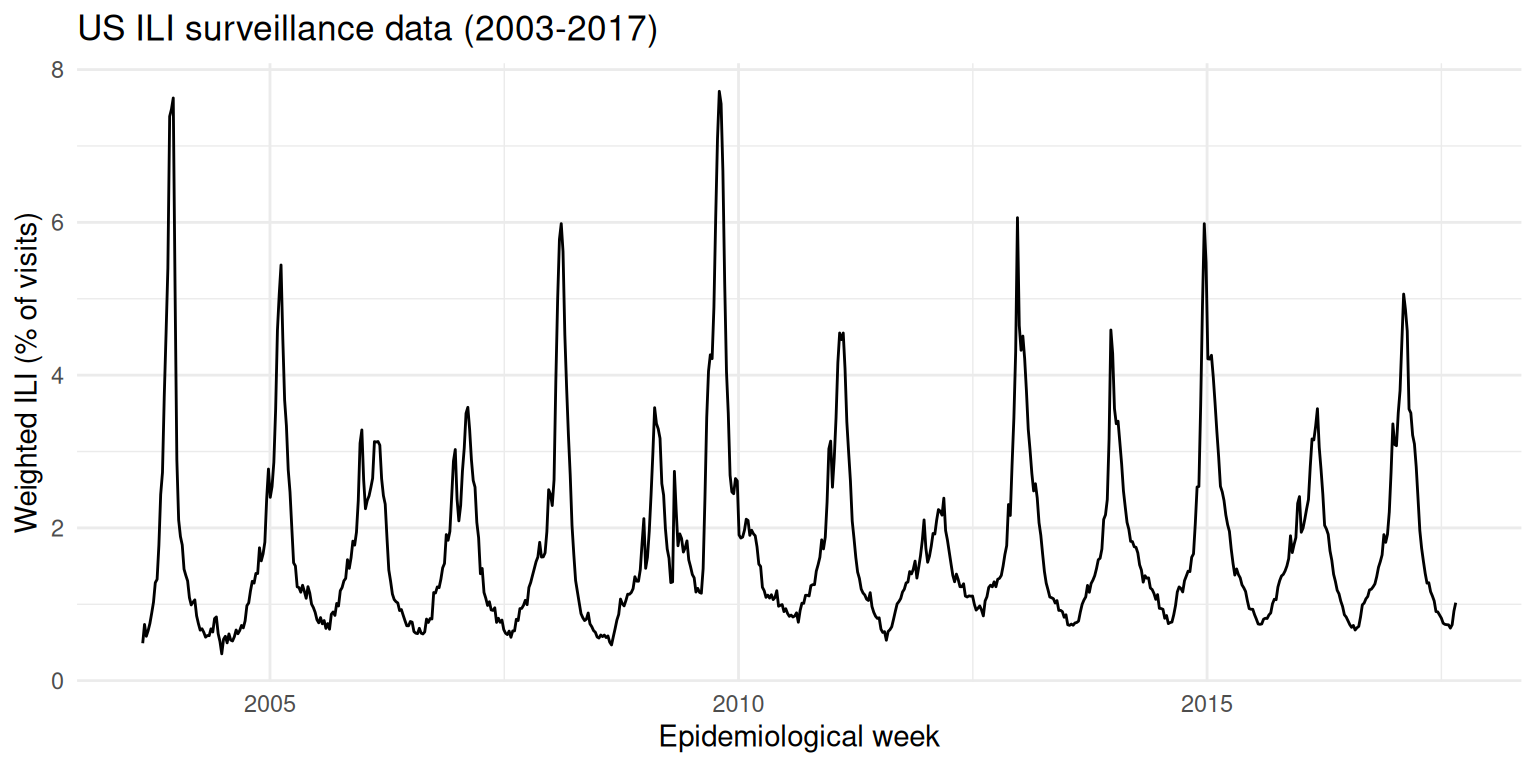
Sometimes we can only access proxy data
Influenza-like illness (ILI): fever AND additional “flu-like” symptom (cough, headache, sore throat, etc.)
- Used when direct case data isn’t available
- Measures % of outpatient visits due to ILI
![]()
Aim of this course:
How can we use data typically collected for other purposes to answer questions like
- what is the number of cases now? (nowcasting)
- is it rising/falling and by how much? (\(R_t\) estimation)
- how can we handle unknown reporting delays? (joint nowcasting)
in real time.
Approach
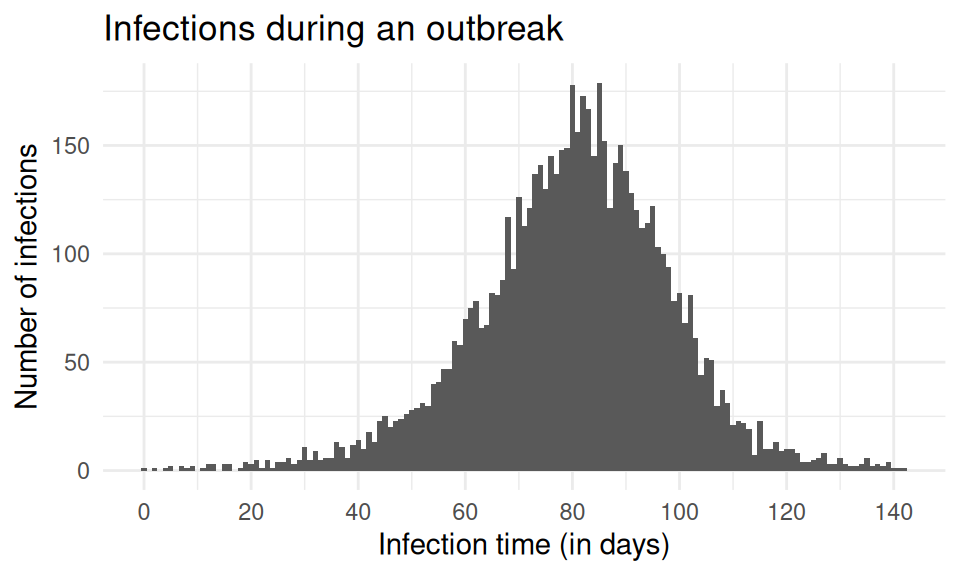
Throughout the course we will
- use models to simulate data sets in R
(the generative model of the simulated data)
![]()
Approach
Throughout the course we will
- apply generative models to simulated data in Stan to
- learn about the system (conduct inference)
- make nowcasts (estimate current state)
Approach
Throughout the course we will
- demonstrate joint nowcasting methods for handling unknown reporting delays
Approach
Throughout the course we will
- build understanding through hands-on exercises with simulated and real surveillance data.
Timeline
- \(R_t\) estimation using the renewal equation (session 1)
- nowcasting concepts and methods (session 2)
- joint nowcasting with unknown reporting delays (session 3)