Introduction to biases in epidemiological delays
Biases in epidemiological delays
Why might our estimates of epidemiological delays be biased?
- data reliability and representativeness
- intrinsic issues with data collection and recording
Issue #1: Double censoring
- reporting of events usually as a date (not date + precise time)
- for short delays this can make quite a difference
- accounting for it incorrectly can introduce more bias than doing nothing
Double censoring: example
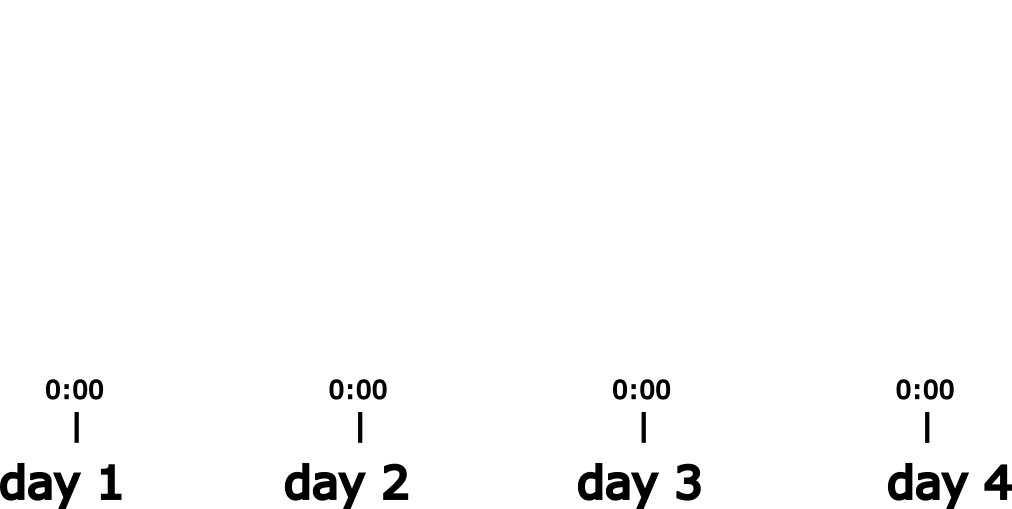
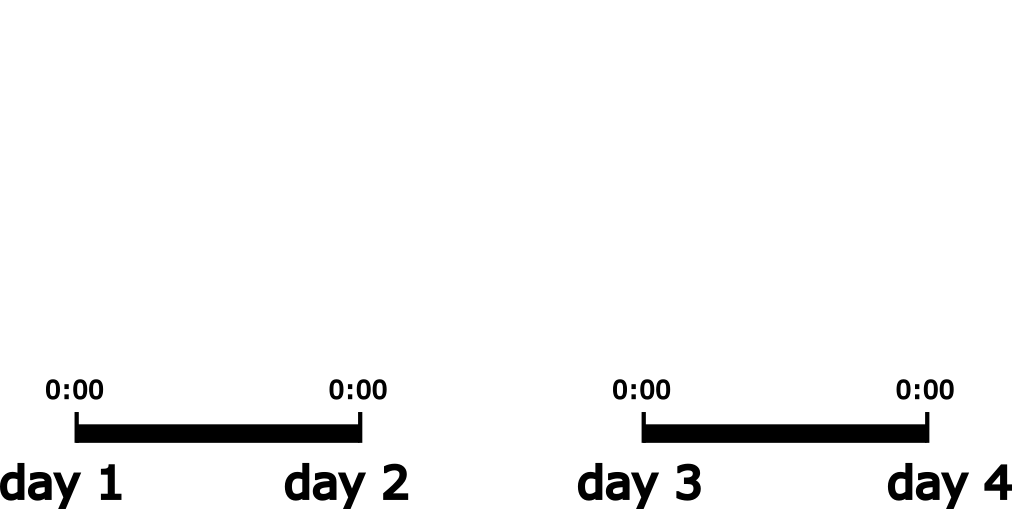
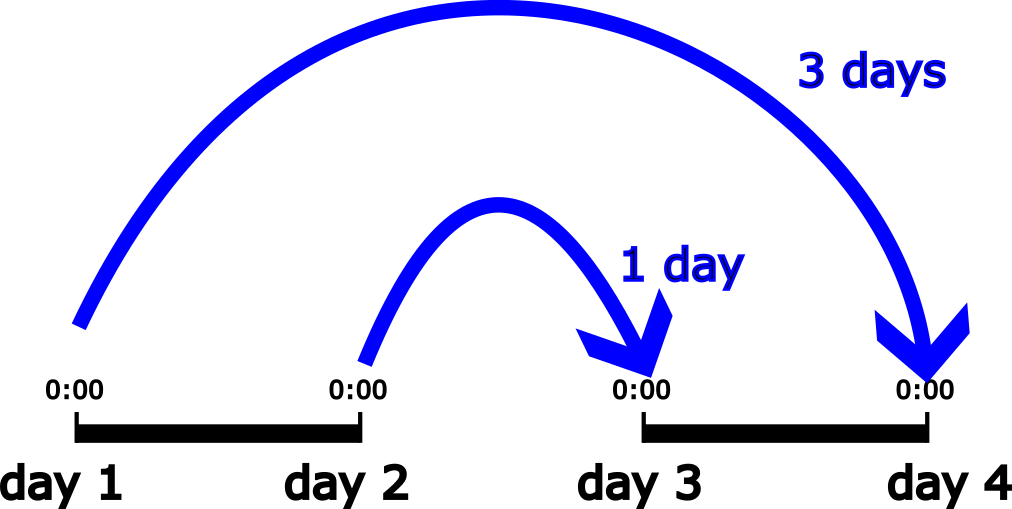
We are trying to estimate an incubation period. For person A we know exposure happened on day 1 and symptom onset on day 3.
Double censoring: example
We are trying to estimate an incubation period. For person A we know exposure happened on day 1 and symptom onset on day 3.
Double censoring: example
We are trying to estimate an incubation period. For person A we know exposure happened on day 1 and symptom onset on day 3.
Double censoring: example
We are trying to estimate an incubation period. For person A we know exposure happened on day 1 and symptom onset on day 3.

The true incubation period of A could be anywhere between 1 and 3 days (but not all equally likely).
Understanding double censoring components
Double interval censoring can be decomposed into:
Primary event censoring: Uncertainty about when the first event occurred within its reported day
Secondary event censoring: Uncertainty about when the second event occurred within its reported day
Warning
A common mistake is to only account for secondary event censoring while ignoring primary event censoring.
Issue #2: right truncation
- reporting of events can be triggered by the secondary event
- in that case, longer delays might be missing because whilst the primary events have occurred the secondary events have not occurred yet
Example: right truncation
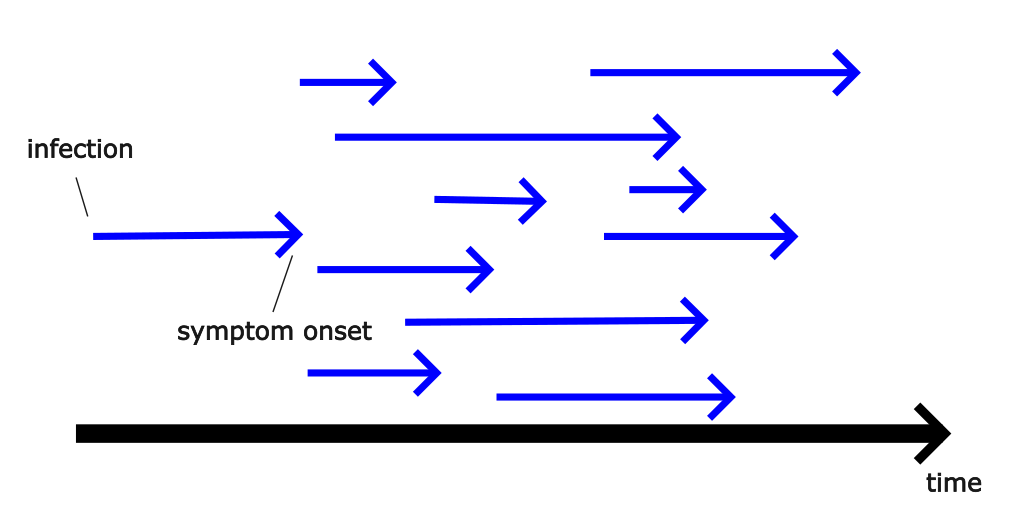
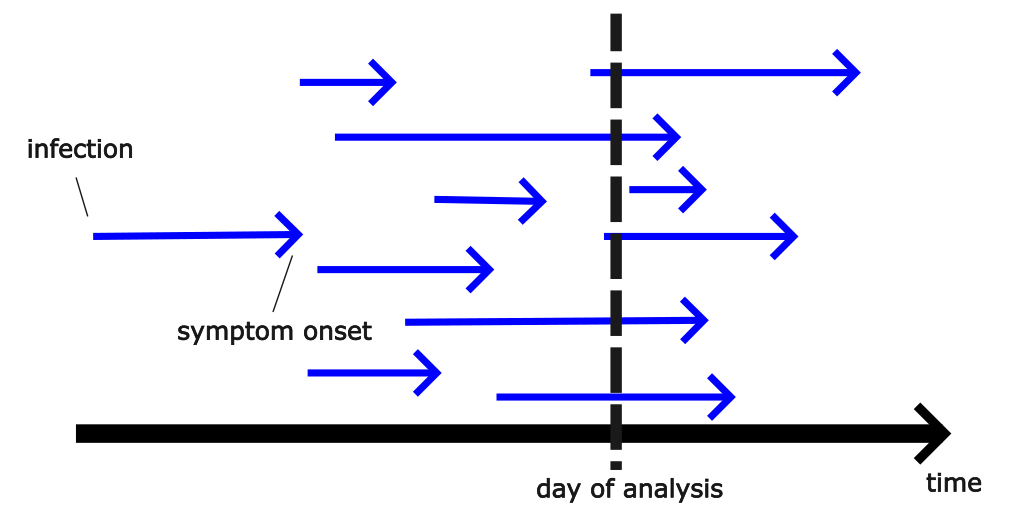
We are trying to estimate an incubation period. Each arrow represents one person with an associated pair of events (infection and symptom onset).
Example: right truncation
We are trying to estimate an incubation period. Each arrow represents one person with an associated pair of events (infection and symptom onset).
Example: right truncation
We are trying to estimate an incubation period. Each arrow represents one person with an associated pair of events (infection and symptom onset).
Example: right truncation
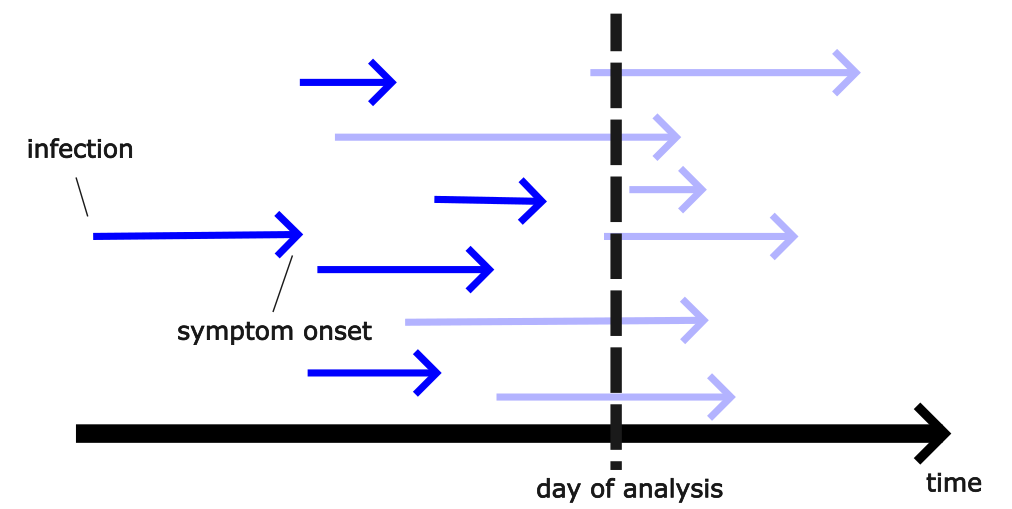
We are trying to estimate an incubation period. Each arrow represents one person with an associated pair of events (infection and symptom onset)

On the day of analysis we have not observed some onsets yet. The delay from infection to onset for these delays tended to be longer. This is made worse during periods of exponential growth.
Example: right truncation
We are trying to estimate an incubation period. Each arrow represents one person with an associated pair of events (infection and symptom onset)

We need to account for infections with longer delays that we haven’t yet observed. We can best do this by using a lognormal distribution for the delays that we do have data on.
Censoring and right truncation
- When analysing data from an outbreak in real time, we are likely to have double censoring and right truncation, making things worse
- In the practical we will only look at the two separately to keep things simple
Your Turn
- Simulate epidemiological delays with biases
- Estimate parameters of a delay distribution, correcting for biases
Introduction to biases in epidemiological delays