Introduction to joint estimation of nowcasting and reporting delays
Nowcasting and forecasting of infectious disease dynamics
Motivating example
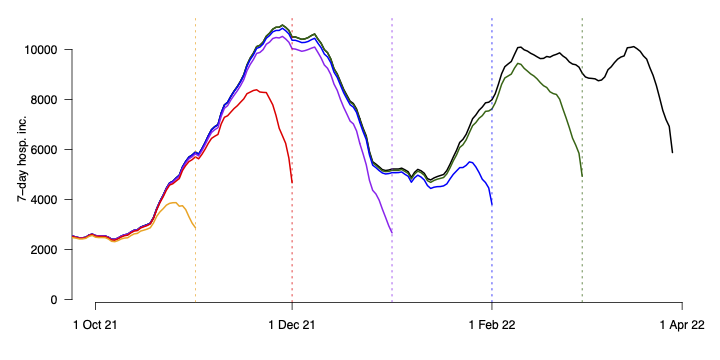
Often we see data like this

(all figures in this deck are courtesy of Johannes Bracher)
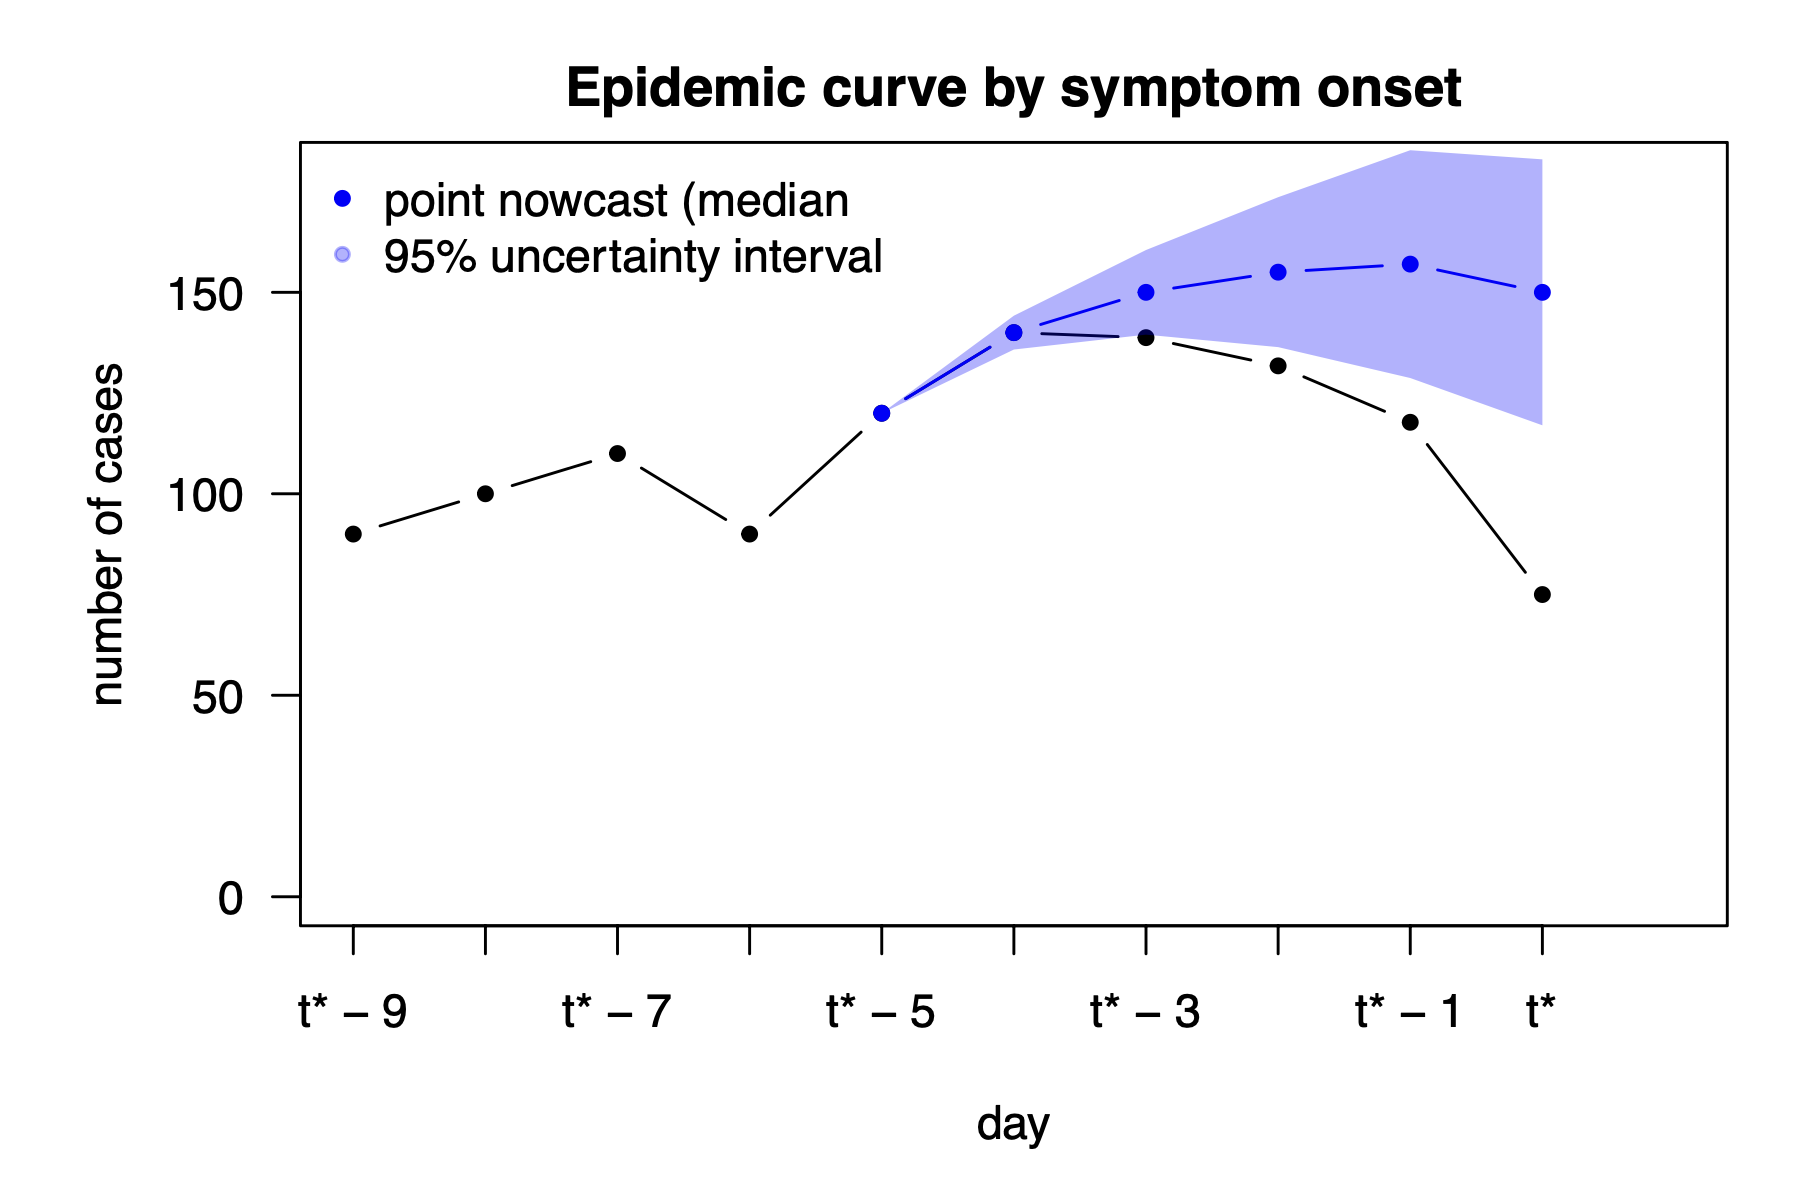
The aim of nowcasting
Predict what an epidemiological time series will look like after all delayed reports are in.

The limitations of simple nowcasting methods
- Hard to propagate uncertainty
- Doesn’t account for observation error in the primary events
- Not a generative model of the data reporting process (hard to add complex reporting patterns)
- If we get the delay wrong, we can get the nowcast wrong
Jointly estimating reporting delays and nowcasting
One potential solution is to jointly estimate the reporting delays and the nowcast. We can do this if we have multiple snapshots of the data.

Building on previous methods
The joint model has three key components:
- Model for underlying counts (what will end up being reported)
- Model for delay distribution (how long the reporting process will be)
- Apply delays to counts (transform onset dates to report dates (like a convolution but we don’t take the sum)))
Your Turn
- Simulate data with delayed reporting
- Perform a joint estimation of the delay and nowcast
- Understand the limitations of the data generating process
- Perform a joint estimation of the delay, nowcast, and reproduction number
Introduction to joint estimation of nowcasting and reporting delays