Introduction to nowcasting
Nowcasting and forecasting of infectious disease dynamics
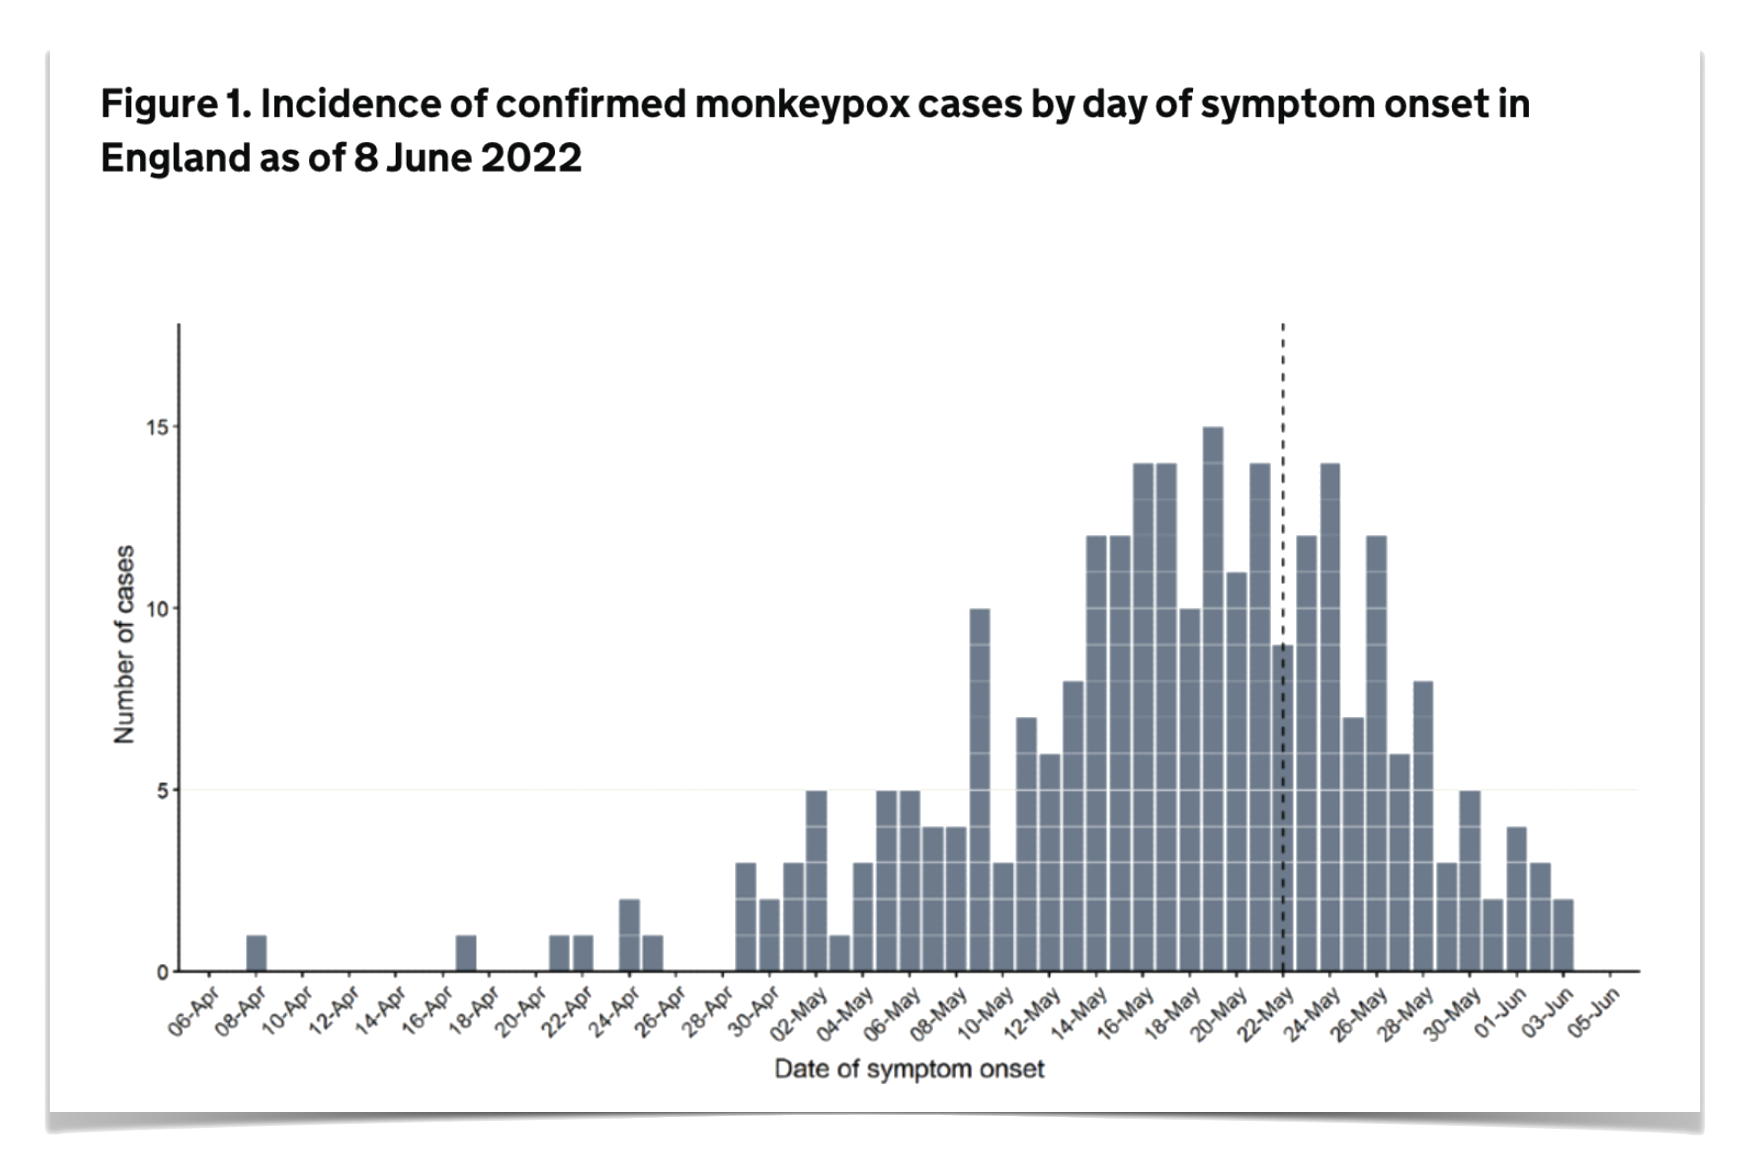
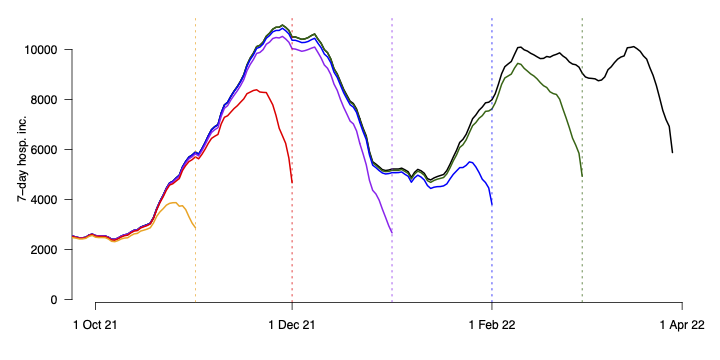
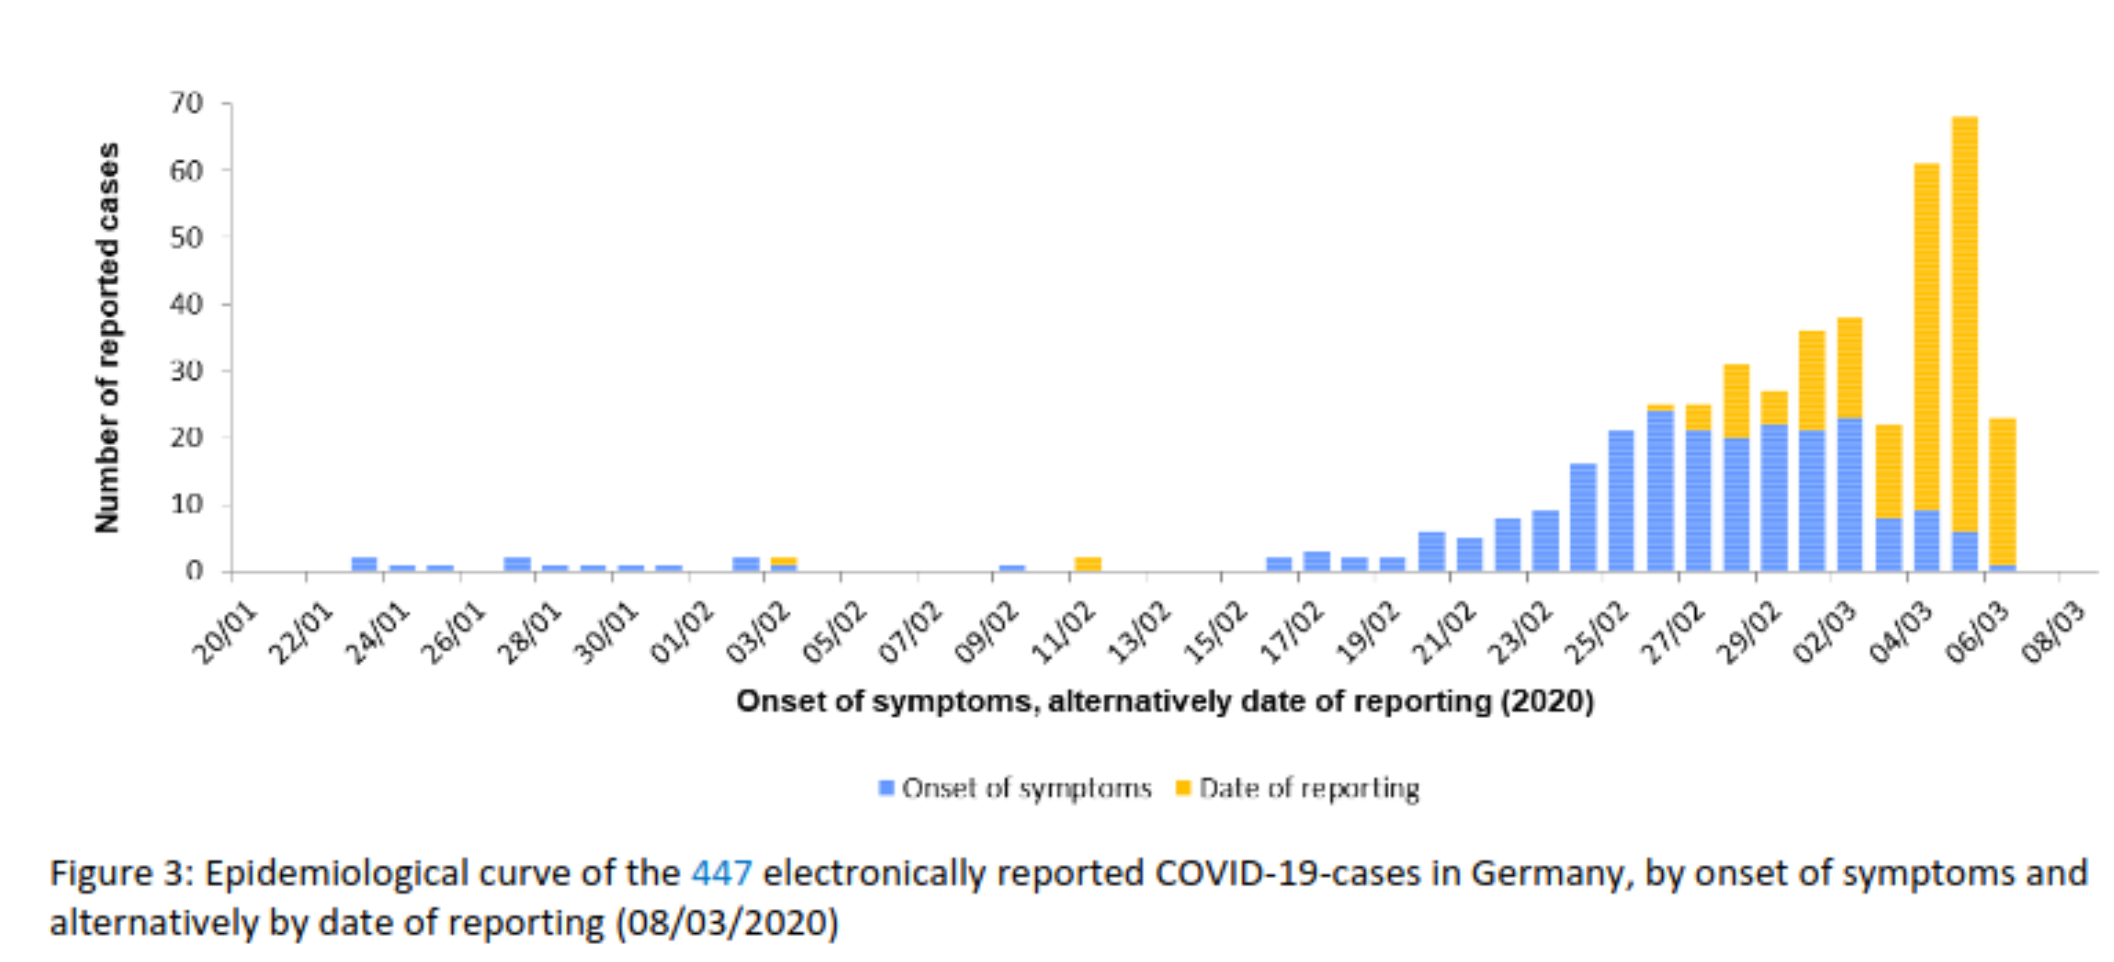
These patterns arise because:
- Epidemiological time series are aggregated by the epidemiologically meaningful date (e.g. symptom onset, hospital admission, death)
- There is a delay between this date, and the events showing up in the data
- This leads to an “articifial” dip in the most recent data
Nowcasting as right truncation
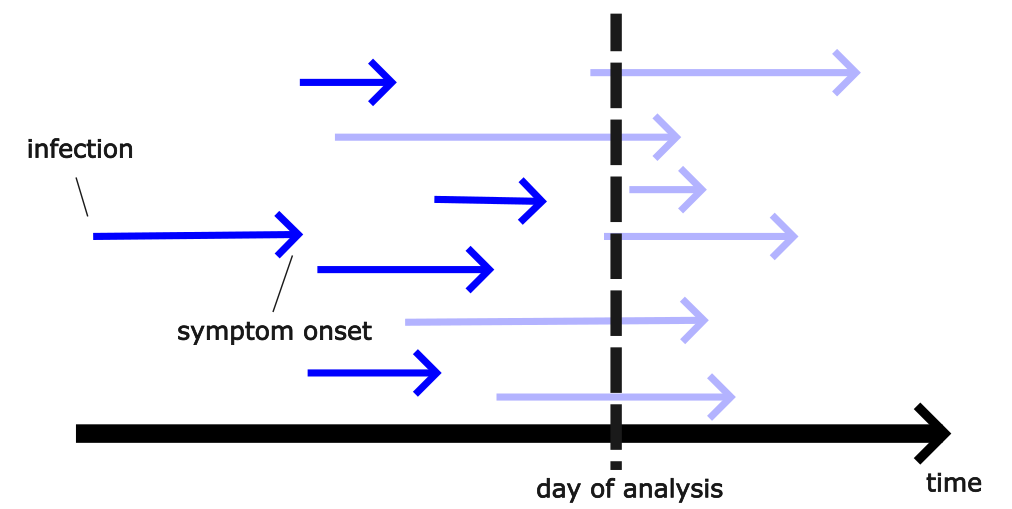
Right truncation
- reporting of events can be triggered by the secondary event
- in that case, longer delays might be missing because whilst the primary events have occurred the secondary events have not occurred yet
Nowcasting is exactly this!
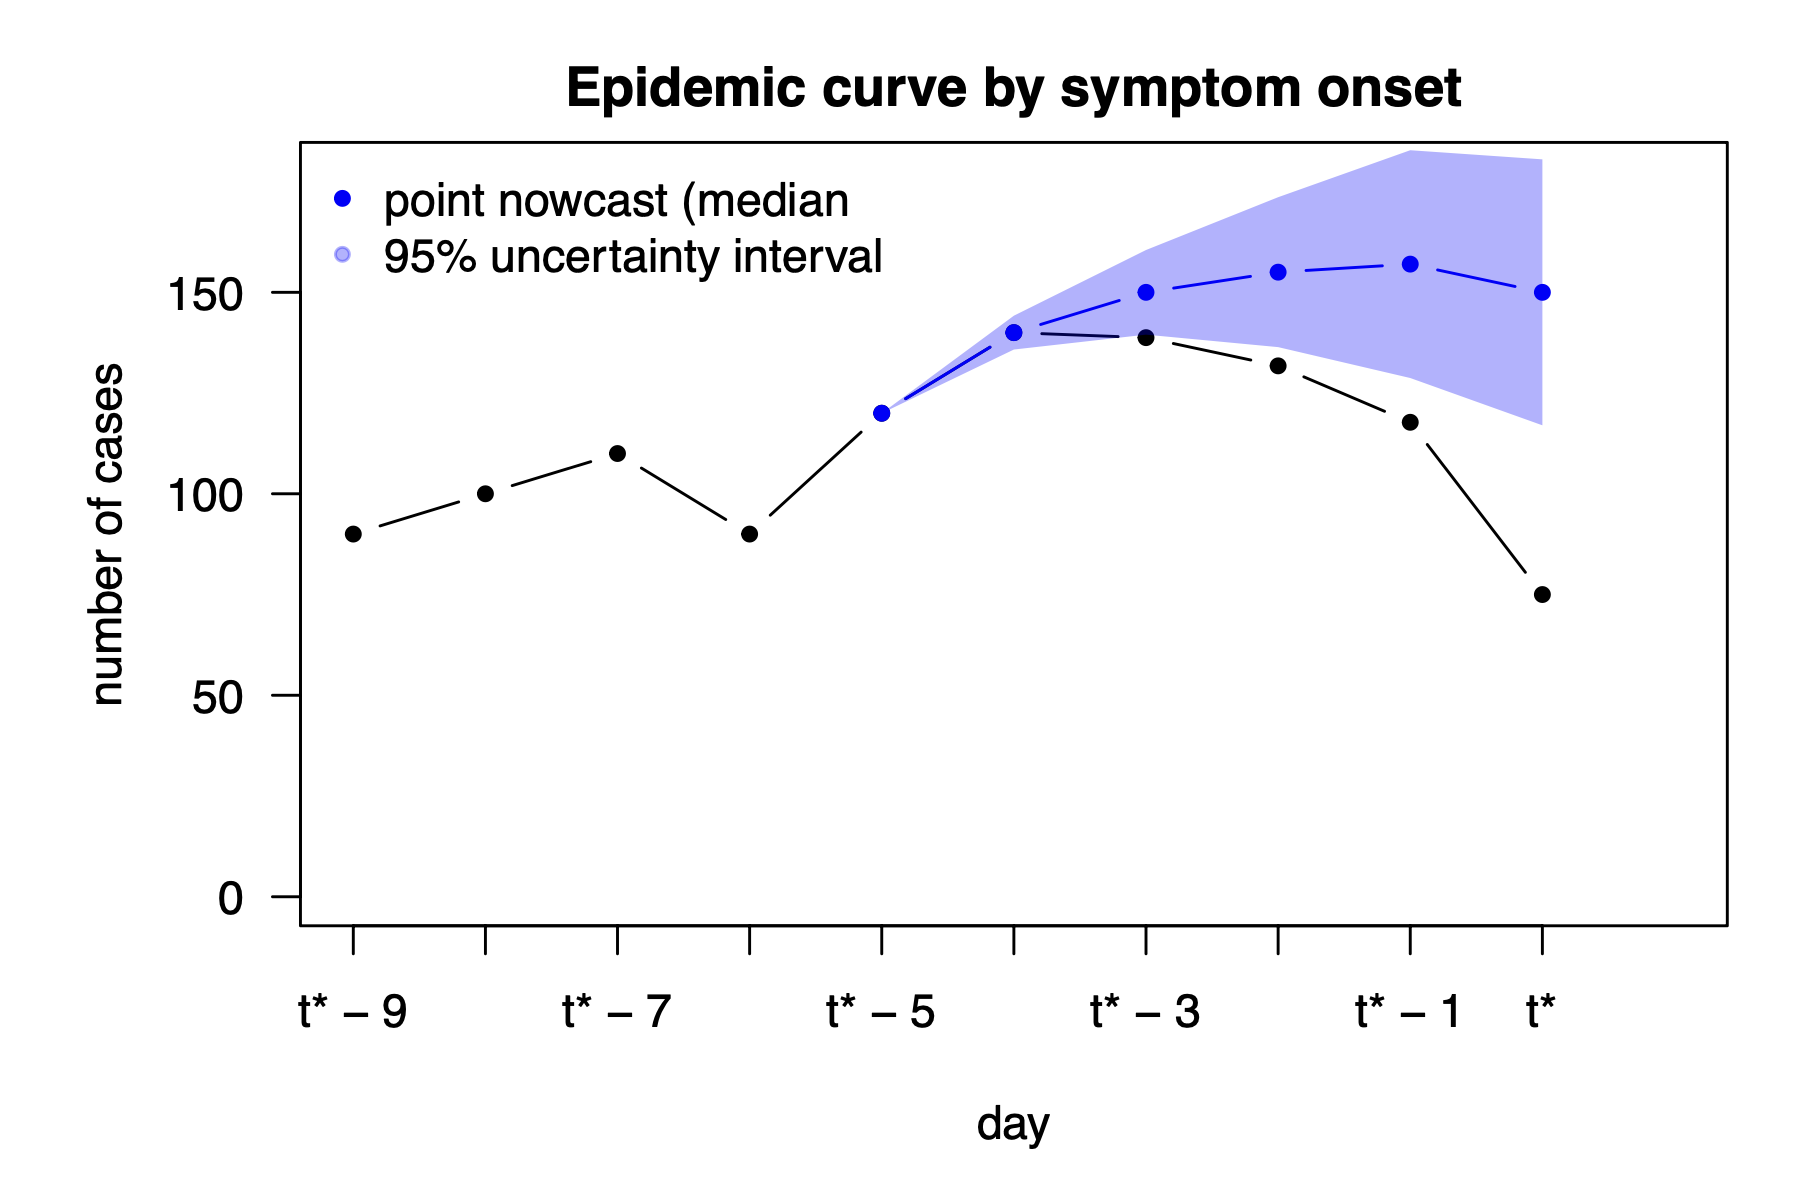
The aim of nowcasting
Predict what an epidemiological time series will look like after all delayed reports are in.
![]()
(slide courtesy of Johannes Bracher)
A simple approach to nowcasting
- Estimate the delay distribution from other data
- Specify a model for the epidemic dynamics
- Use the estimated delay distribution to model the expected right truncation in the data
- Fit the model to the truncated data
- Use the untruncated estimates from the model as the nowcast
Your Turn
- Perform nowcast with a known reporting delay distribution
- Perform a nowcast using a more realistic data generating process
- Explore the impact of getting the delay distribution wrong