From an epidemiological line list to informing decisions in real-time
Nowcasting and forecasting of infectious disease dynamics
“We were losing ourselves in details […] all we needed to know is, are the number of cases rising, falling or levelling off?”
Hans Rosling, Liberia, 2014
- what is the number of cases now?
- is it rising/falling and by how much?
- what does this mean for the near future?
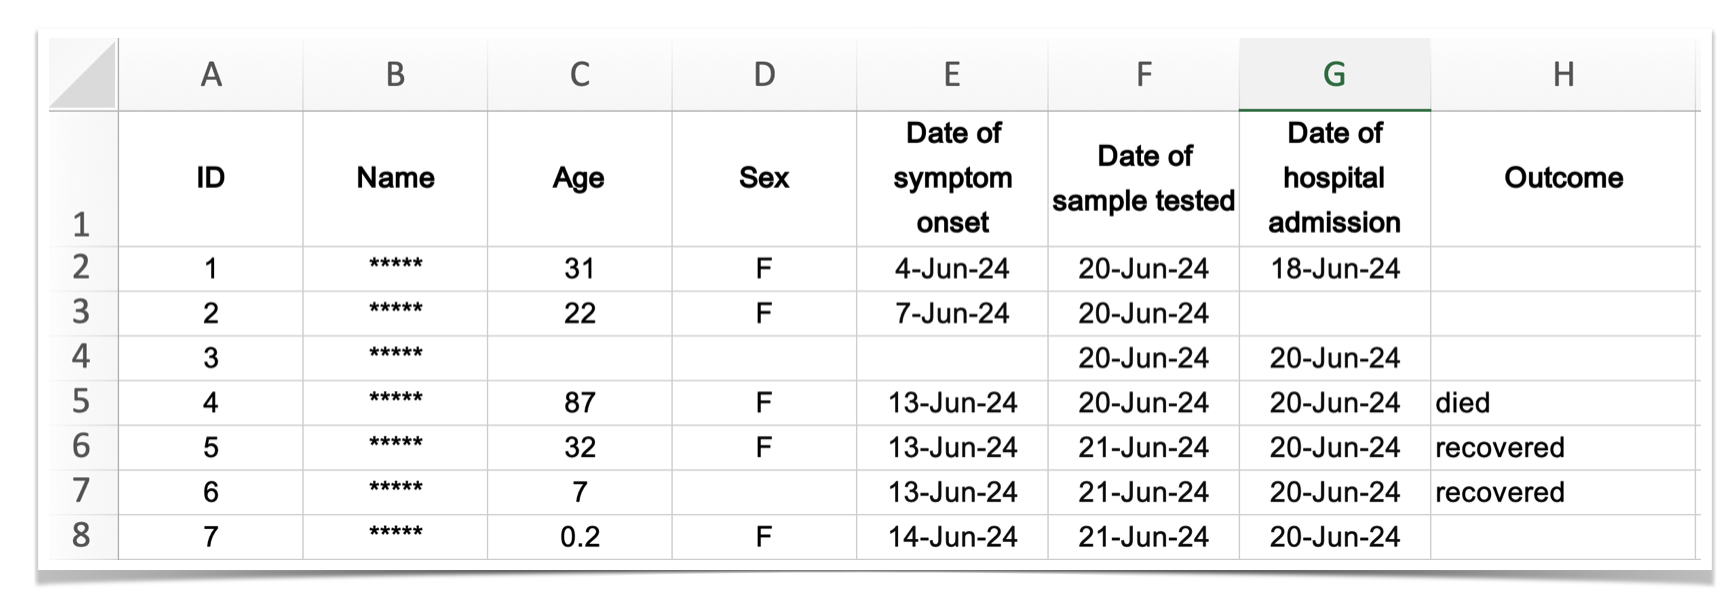
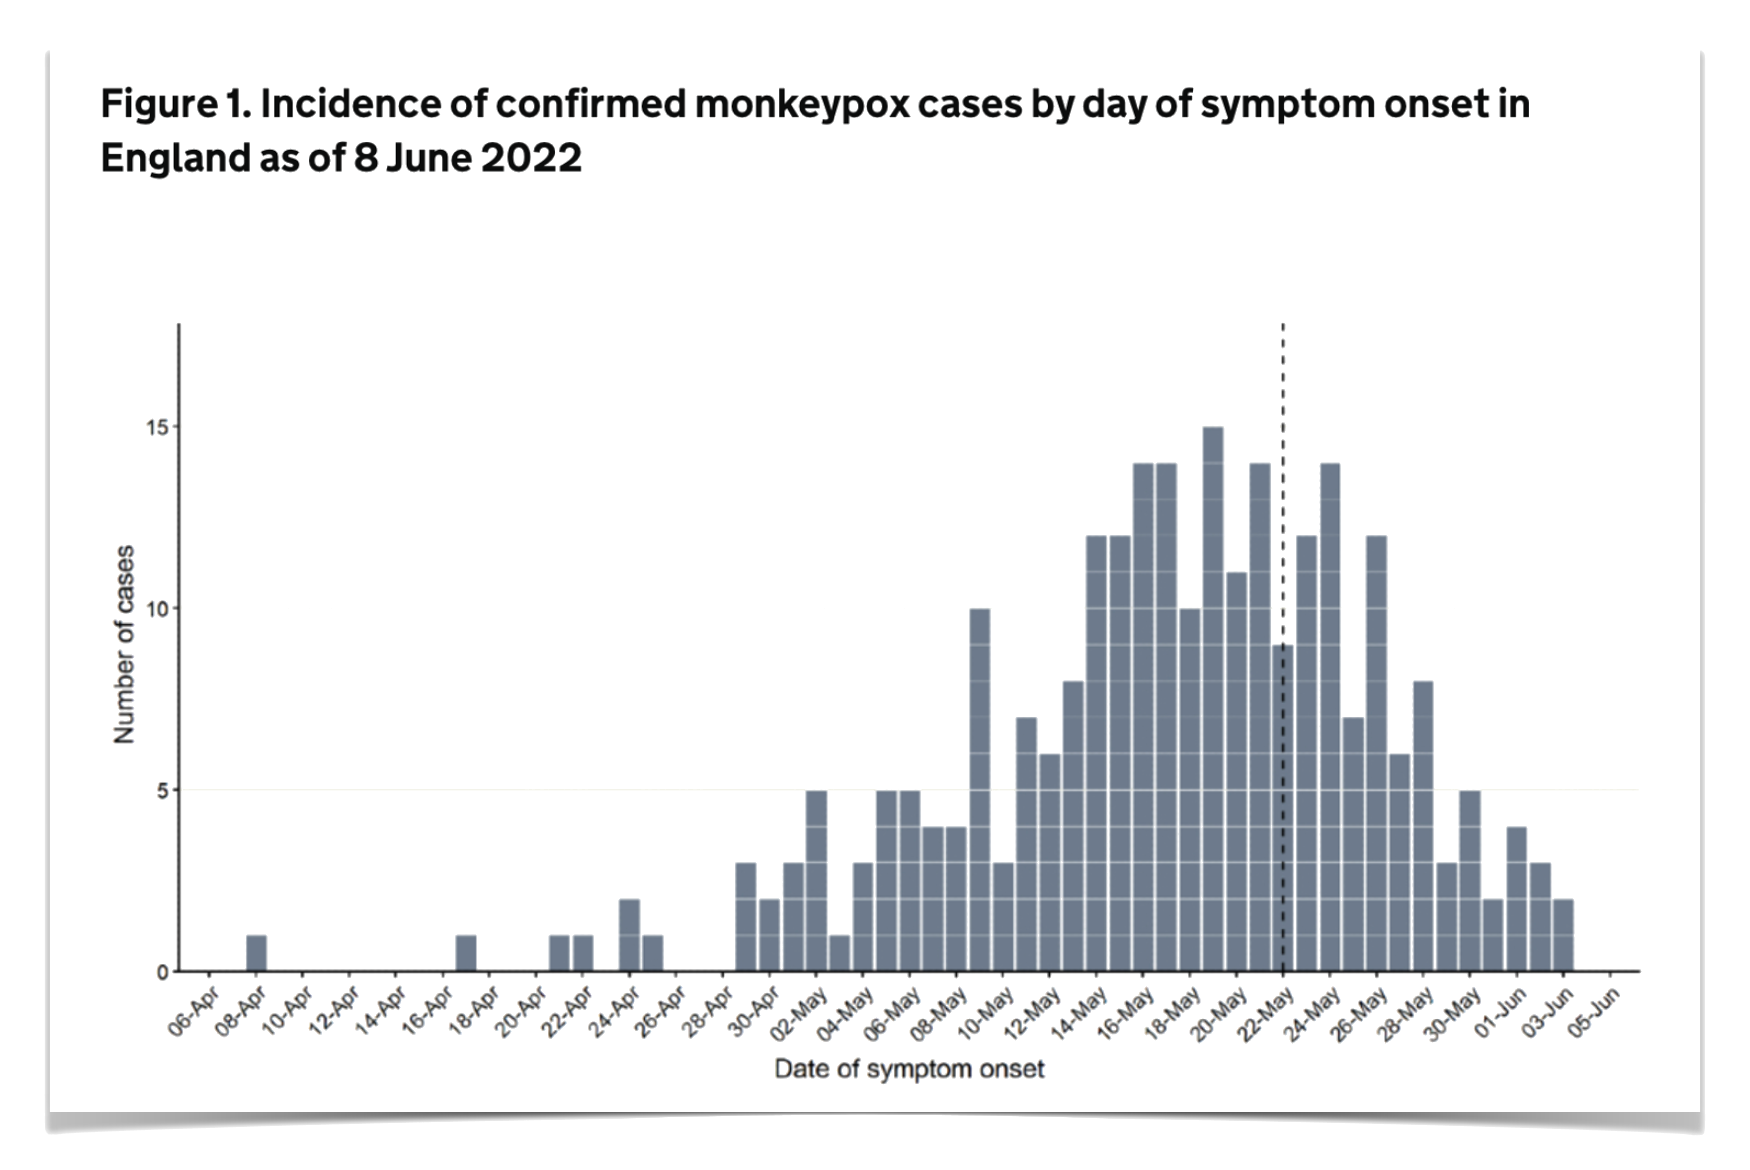
Data usually looks like this
![]()
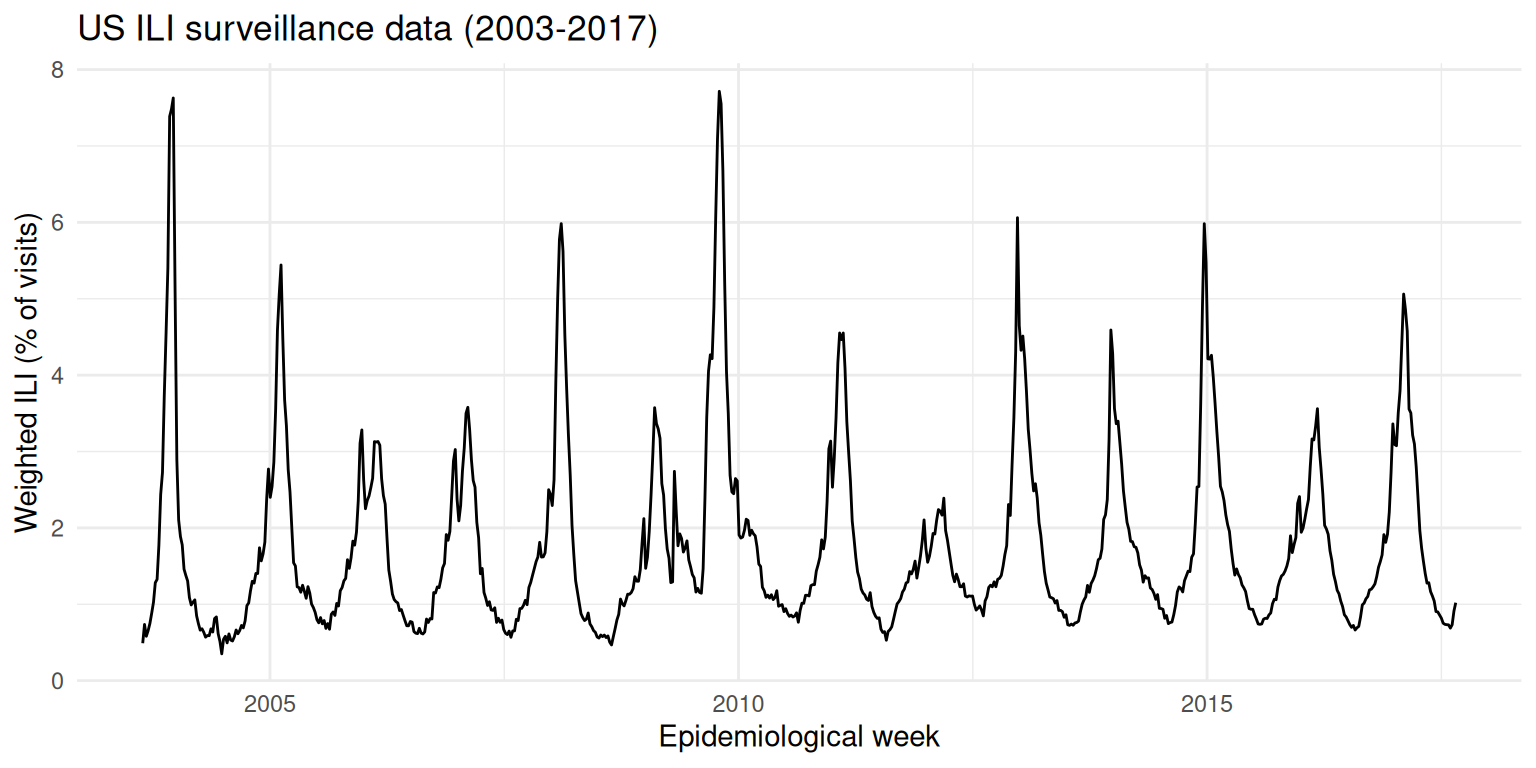
Sometimes we can only access proxy data
Influenza-like illness (ILI): fever AND additional “flu-like” symptom (cough, headache, sore throat, etc.)
- Used when direct case data isn’t available
- Measures % of outpatient visits due to ILI
![]()
Aim of this course:
How can we use data typically collected for other purposes to answer questions like
- what does the recent trend mean for the near future? (forecasting)
- how good are our predictions, and how can we tell? (evaluation)
- how can we combine and share models? (ensembles & hubs)
in real time.
Approach
Throughout the course we will
- work with real epidemiological surveillance data in R
- fit time-series forecasting models and make predictions
- evaluate forecasts using proper scoring rules
- combine models into ensembles and contribute to collaborative modelling hubs
Timeline
- forecasting concepts and models (day 1)
- forecast evaluation and ensembles (day 2)
- collaborative forecasting with hubs and course wrap-up (day 3)