%%{init: {'theme':'base', 'themeVariables': {'fontSize':'26px'}, 'flowchart': {'curve':'basis', 'nodeSpacing':45, 'rankSpacing':55}}}%%
flowchart LR
  A["Fork the hub"] --> B["Clone your fork"]
  B --> C["Add forecasts<br/>+ metadata"]
  C --> D["Commit & push"]
  D --> E["Open a PR"]
  E --> F{"Checks<br/>pass?"}
  F -- no --> C
  F -- yes --> G["Merged →<br/>dashboard 🎉"]
Selecting test-phase models
Forecasting & evaluation of infectious disease dynamics
From validation to testing
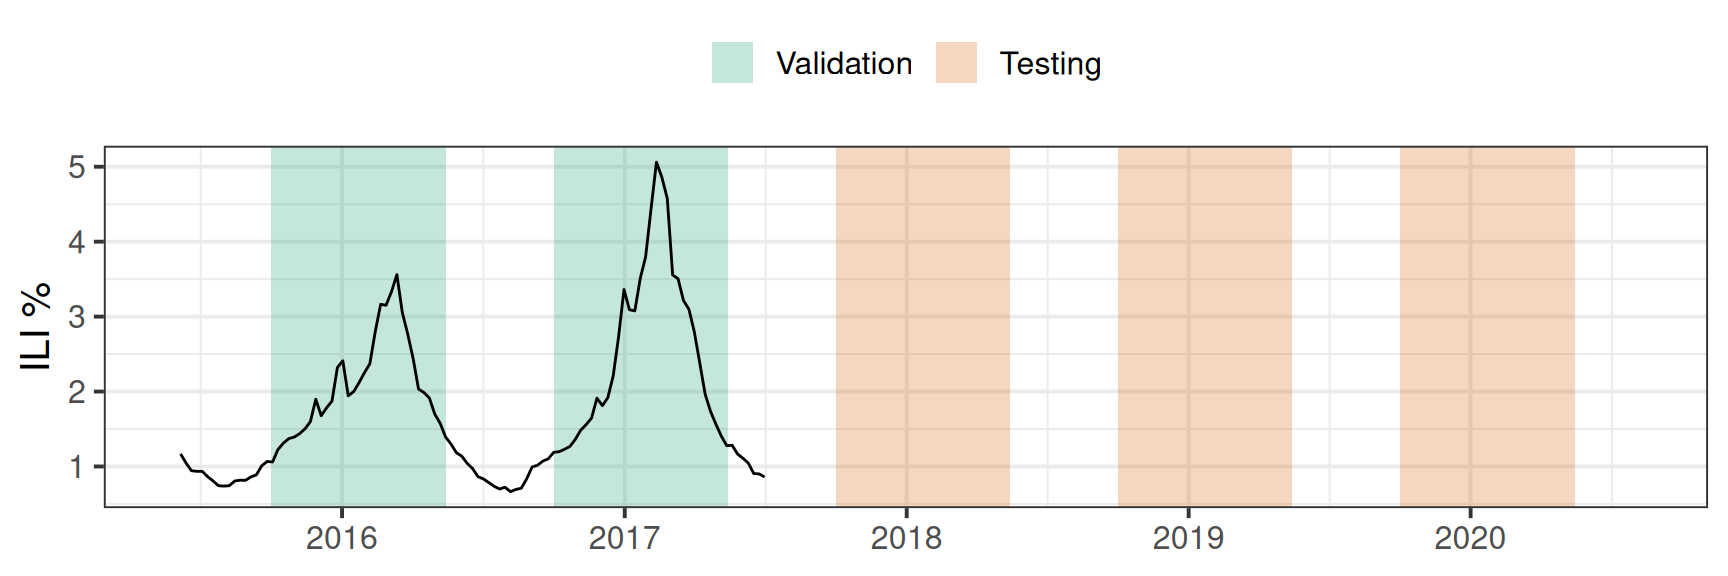
- You built many models on the two validation seasons.
- Now: choose just 1–2 to carry into the three testing seasons.
- The testing seasons stand in for real-time forecasting.
The temptation
From the earlier session: you have several (or many) fitted models and their validation scores.
Tempting move: submit the one with the best validation score.
Caution
But — will it still be the best on seasons it has never seen?
Validation rank ≠ test rank
- Each forecast is out-of-sample in time — the model never sees the weeks it predicts.
- But across the validation seasons you iterate: tweak, refit, re-score, keep what looks best.
- So those seasons quietly become in-sample for model selection — you are, in effect, fitting to them.
- And it’s a tiny sample — just two seasons — so the rankings are noisy and optimistically biased.
If you’ve seen one flu season…
The saying at CDC goes:
If you’ve seen one flu season… you’ve seen one flu season.
In other words, every season is unique!
Caution
This further suggests that we need to be cautious about assuming that validation phase patterns will be the same in the unpeeked-at testing seasons.
How to choose
Favour models that are:
- ✅ consistently good in CV — not just the single lowest validation score
- ✅ parsimonious — fewer parameters means the model is less likely to be overfit
- ✅ diverse — e.g. best
ARIMA, bestNNETAR, best ensemble - ✅ stable across seasons and locations
Then pass only 1–2 to the testing phase.
Tip
The best-looking model isn’t reliably the best forecaster.
Your selection rule is a model too
- Every peek at validation to pick a model is a kind of fitting.
- Decide your rule, then commit — don’t tune on the testing seasons.
- A simpler selection process → a more trustworthy test result.
The testing phase = real-time
- Treat 2017/18–2019/20 as if it were live: generate once, no refitting, no peeking.
Note
Our cross-validation uses the vintage data available at each date, so — like the original hub models — you forecast from real-time data, not finalized data.
Why submit to an online hub?
- A shared format → automatic validation of your submission
- Line your forecasts up against others — and build ensembles
- The reward: your model on the public dashboard
Two ways to submit
Get help — hand your files to an instructor/TA/classmate to upload
Drag & drop — Upload files using web interface to GitHub.com. (you still need a GitHub account)
Fork → clone → PR — the full GitHub workflow, on your own
The pull-request loop (if using GitHub)
Watch the automated checks; fix any errors they flag.
Your Turn
- Select 1–2 models from your validation work.
- Generate test-phase forecasts (seasons 2017/18–2019/20).
- Submit them to the hub via a pull request.
- Find yourself on the dashboard!
References
Selecting test-phase models