Forecasting practice and local hubs

Forecasting & evaluation of infectious disease dynamics

Turned loose!

We’ve covered a ton of material on creating, visualizing, evaluating and ensembling forecasts.

Now it’s your turn to work more independently on these tasks in our “Sandbox Hub”.

Sandbox hub

Similar to our earlier ILI examples, but with data from multiple locations.
The SISMID ILI Forecasting Sandbox is an actual, live hub.
Check out the interactive dashboard!

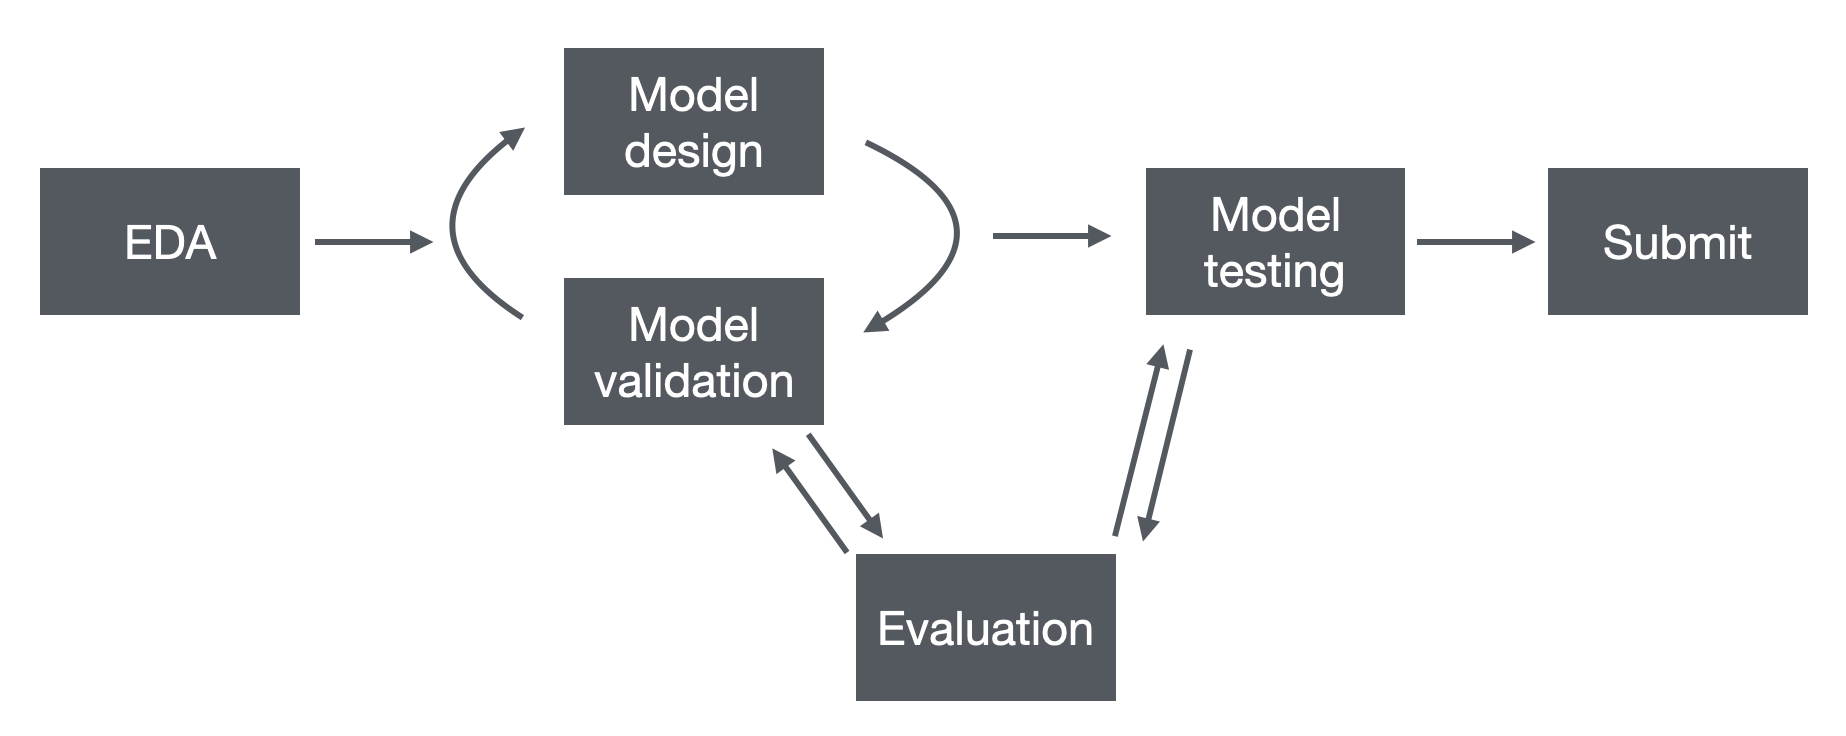
Model development workflow

Here is a summary of the forecasting workflow that we have covered in previous sessions:
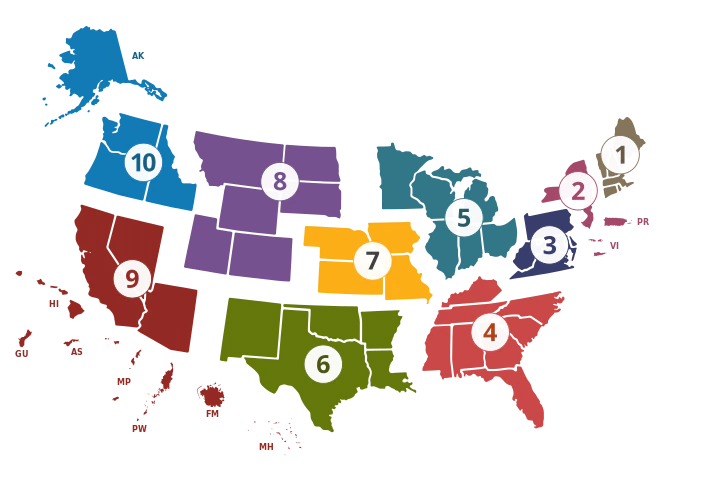
One model, eleven locations

  • Targets: US National + 10 HHS regions.
  • Set location as the tsibble key
  • …and fable fits & forecasts all 11 in one call.
  • Target: “ili perc”, quantile predictions, 1–4 weeks ahead.
The shape of a hub forecast

A prediction task corresponds to a unique combination of:

  • location
  • origin_date
  • horizon
  • target_end_date

Each row of data = one quantile of a prediction task:

  • output_type = "quantile"
  • output_type_id = numeric quantile level (e.g., 0.05 or 0.75)
  • value = the predicted value

model_id must be team-model (e.g. sismid-arima210)

Tip

The hubverse format is what lets your model be scored and ensembled alongside everyone else’s.

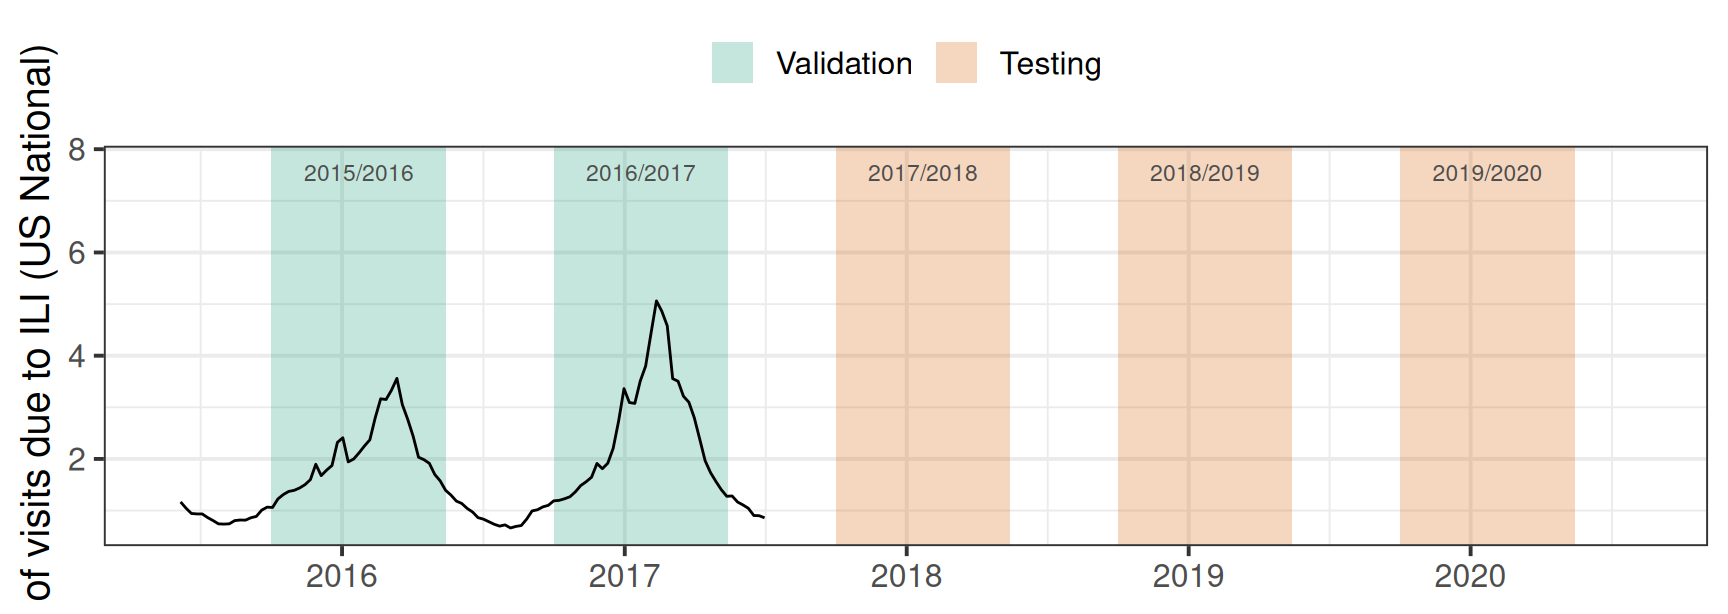
Validation vs. testing seasons

  • Five forecastable seasons in the sandbox hub.
  • First two (2015/16–2016/17) → validation: fit and tune freely.
  • Last threetesting: held out to measure real performance.
  • We deliberately hide the testing seasons’ data so a glimpse of their dynamics can’t bias your modeling.
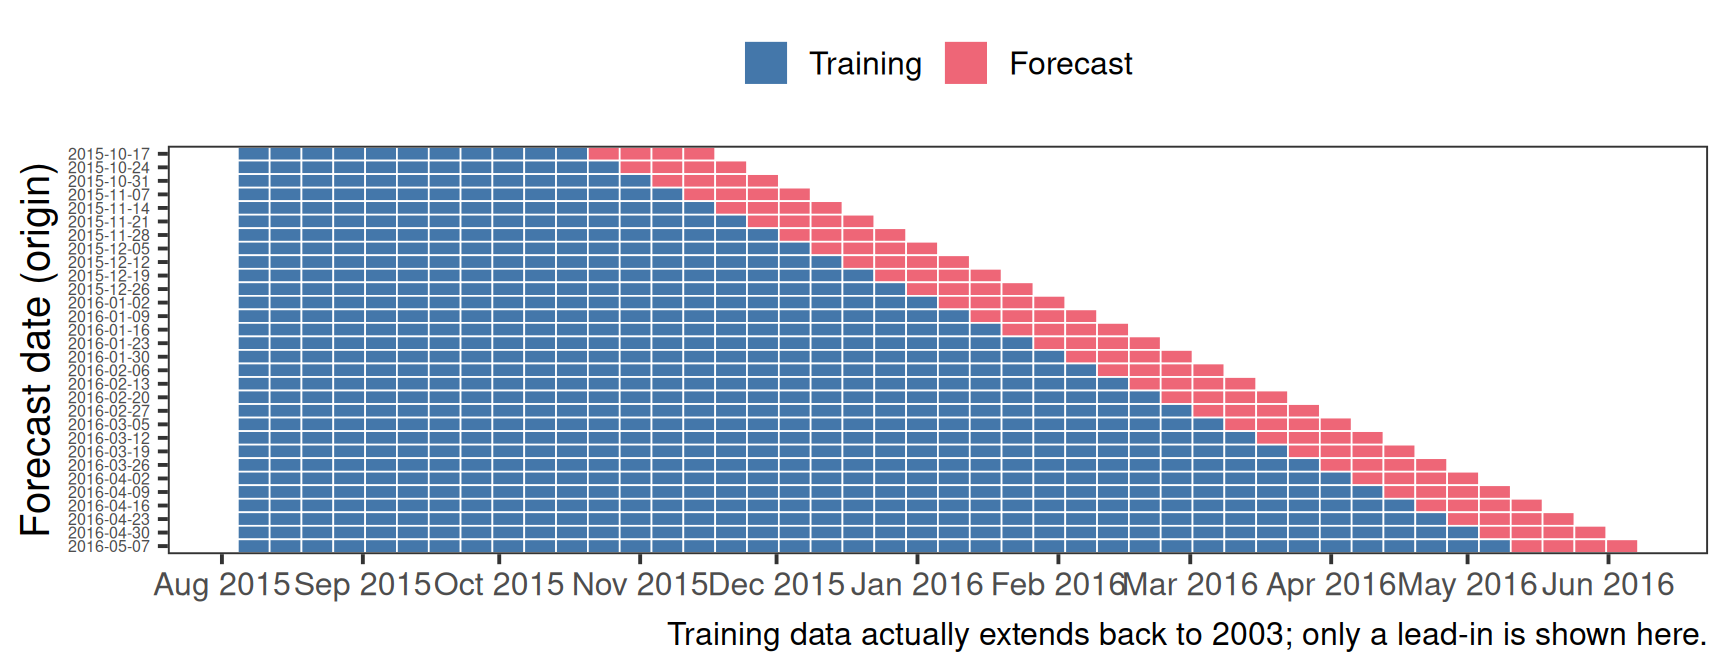
How we forecast each season

  • For every forecast date, refit on all data up to that week
  • …then forecast 1–4 weeks ahead (never peeking forward).
  • Repeat across the season → an expanding window.
Score against the “oracle”

  • Collect all forecasts from the hub (including yours).
  • Compare to the season-final truth with hubEvals::score_model_out()WIS.

Tip

Your models train on the vintage data available in real time — just like the original hub models — so this is a fair, apples-to-apples comparison.

Your Turn

  1. Clone the Sandbox Hub.
  2. Build and visualize forecasts from models that you are interested in.
  3. Validate and score forecasts on first two seasons.

Return to the session