Caution
What are we missing when we only score one horizon and location at a time?
Statistics refresher
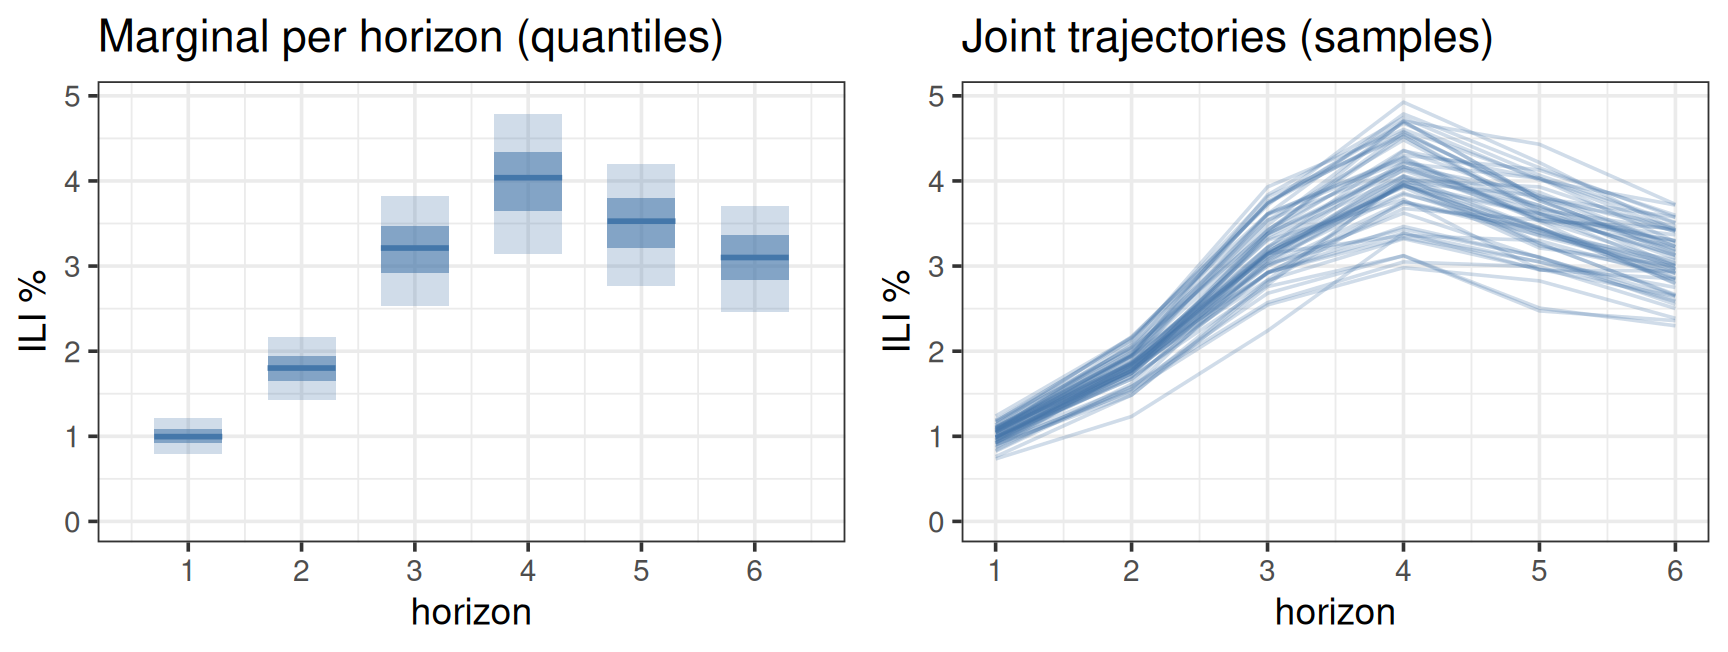
We can think of probabilistic forecasts in similar terms
Figure 1
Here the same quantitative forecasts have different meanings.
A proper scoring rule for a vector outcome \mathbf{y}, generalising the CRPS.
\text{ES}(F, \mathbf{y}) = \mathbb{E}\lVert \mathbf{X} - \mathbf{y} \rVert - \tfrac{1}{2}\,\mathbb{E}\lVert \mathbf{X} - \mathbf{X}' \rVert
With m sample trajectories \mathcal{X}=\{\mathbf{x}_1, \dots, \mathbf{x}_m\} from the forecast, we estimate it by
\widehat{\text{ES}}(\mathcal{X},\mathbf{y}) = \frac{1}{m}\sum_{i=1}^{m}\lVert \mathbf{x}_i - \mathbf{y} \rVert - \frac{1}{2m^2}\sum_{i=1}^{m}\sum_{j=1}^{m}\lVert \mathbf{x}_i - \mathbf{x}_j \rVert
The marginal CRPS is the same for all three forecasts below, but ES are larger with less correlation.
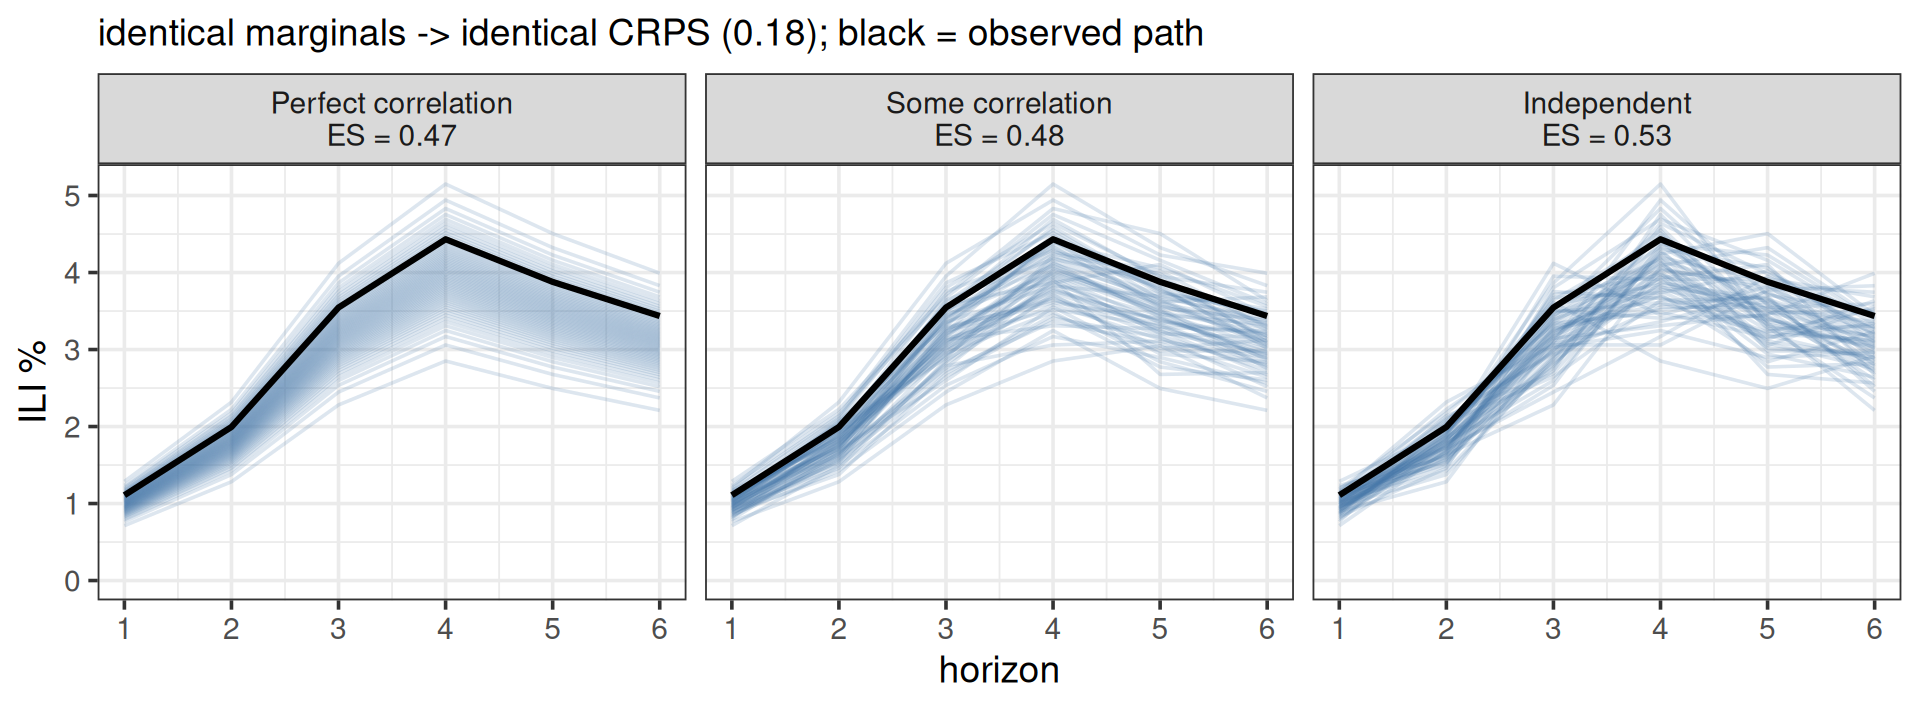
Figure 2
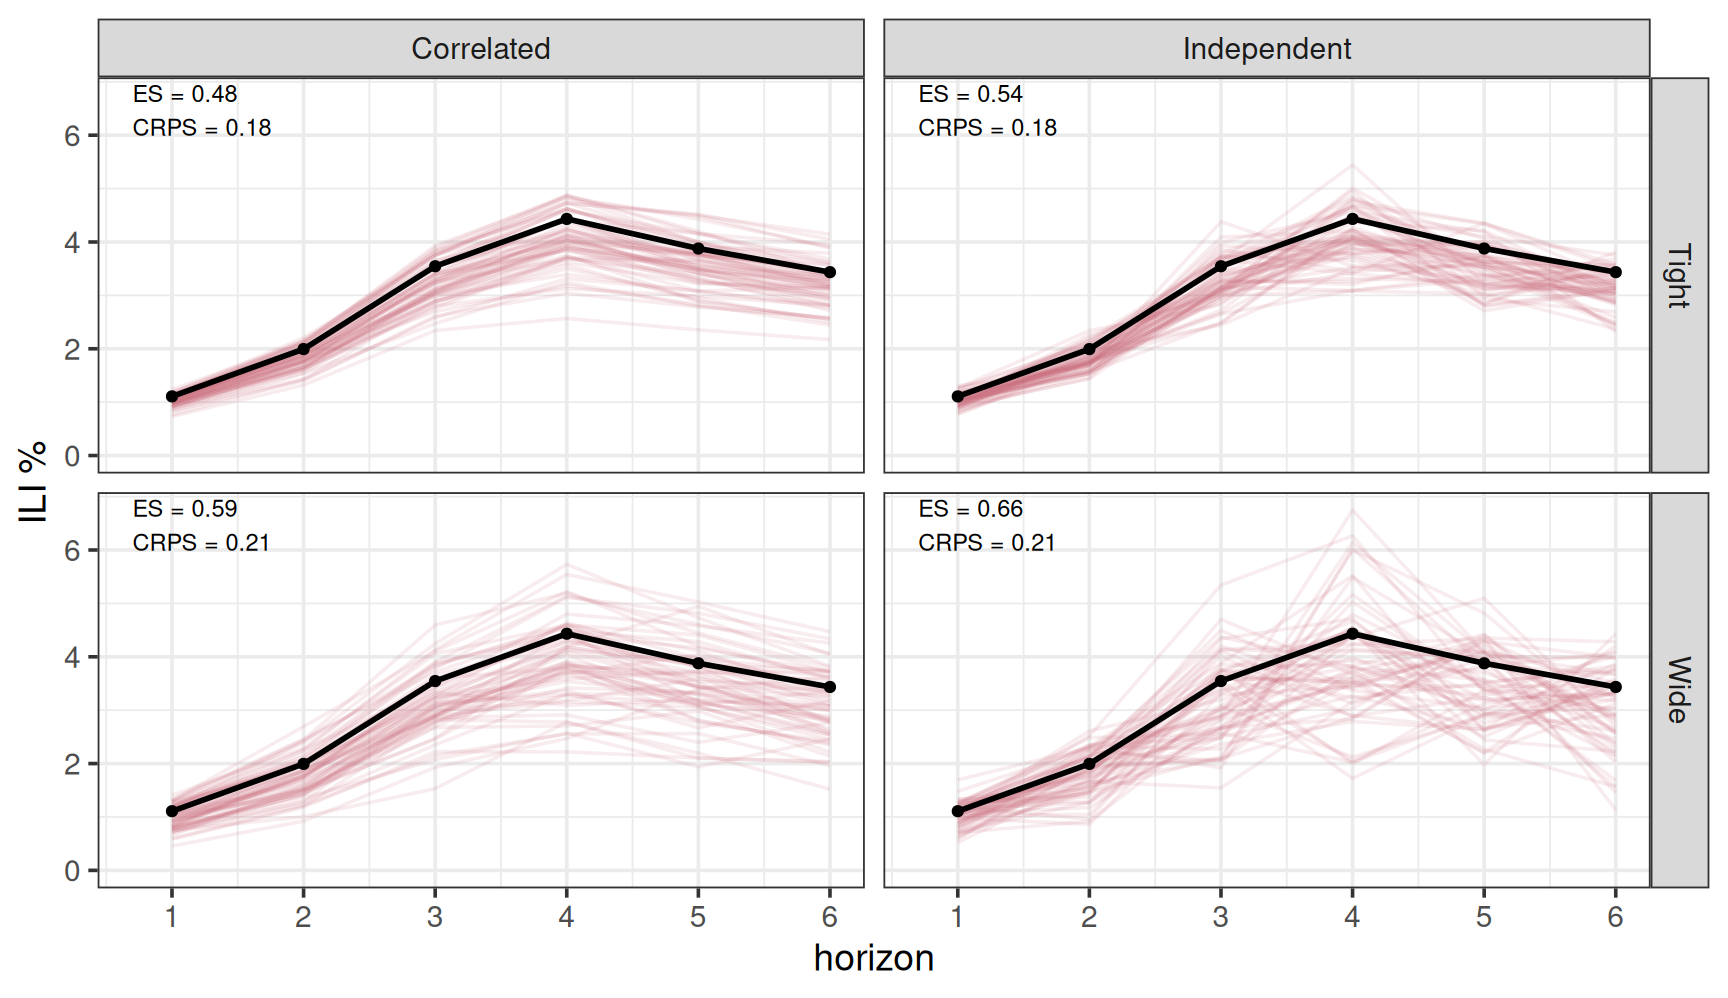
Figure 3
Across a row (same marginals) CRPS is identical. ES improves when horizons are correlated.
Some (not all) models can make forecasts that are joint across horizons AND locations.
Forecasts that are joint across locations could enable decision-support for:
what is the optimal allocation of a fixed resource, like PPE or ventilators?
what is the likelihood that all locations peak at the same time?
Multivariate forecast evaluation