From an epidemiological line list to informing decisions in real-time
Nowcasting and forecasting of infectious disease dynamics
“We were losing ourselves in details […] all we needed to know is, are the number of cases rising, falling or levelling off?”
Hans Rosling, Liberia, 2014
- what is the number of cases now?
- is it rising/falling and by how much?
- what does this mean for the near future?
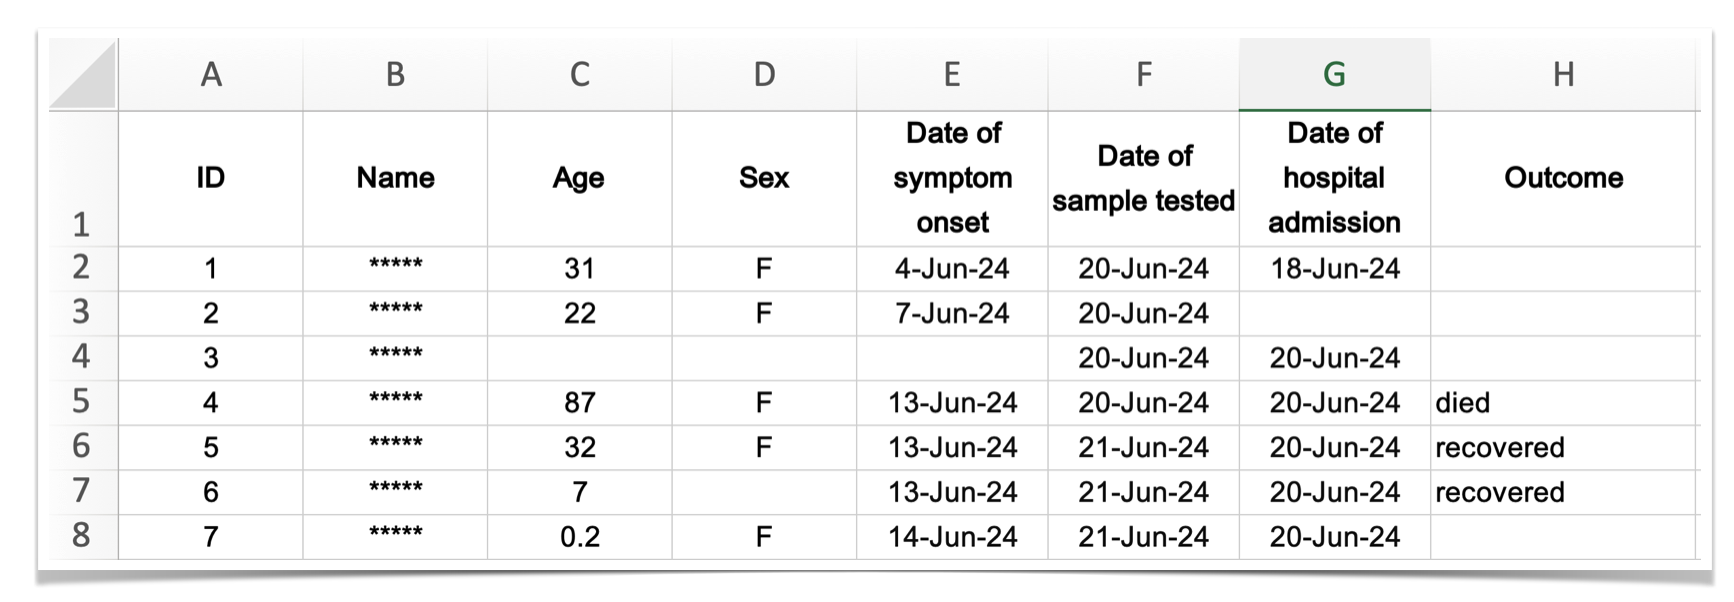
Data usually looks like this
![]()
Aim of this course:
How can we use data typically collected in an outbreak to answer questions like
- what is the number of cases now? (nowcasting)
- is it rising/falling and by how much? (\(R_t\) estimation)
- what does this mean for the near future (forecasting)
in real time.
Approach
Throughout the course we will
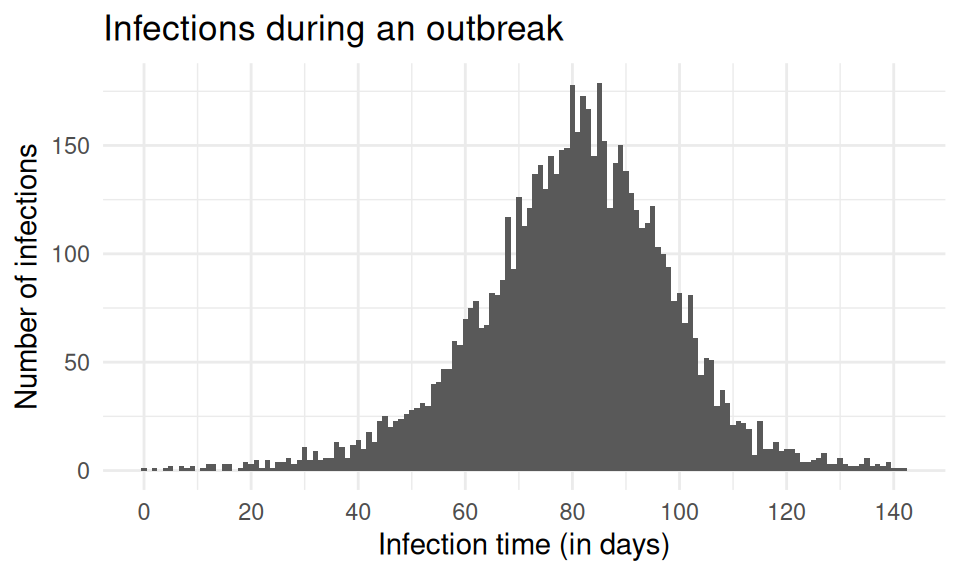
- use models to simulate data sets in R
(the generative model of the simulated data)
![]()
Approach
Throughout the course we will
- apply generative models to simulated data in Stan to
- learn about the system (conduct inference)
- make predictions (nowcasting/forecasting)
Timeline
- delay distributions and how to estimate them
- biases in delays: censoring and right truncation
- using delays to model the data generating process
- \(R_t\) estimation and the renewal equation
- nowcasting, and joint estimation of delays and nowcasts
- linking nowcasting and forecasting
- jointly fitting multiple data sources
- modelling more complex reporting processes