From an epidemiological line list to informing decisions in real-time
Nowcasting and forecasting of infectious disease dynamics
“We were losing ourselves in details […] all we needed to know is, are the number of cases rising, falling or levelling off?”
Hans Rosling, Liberia, 2014
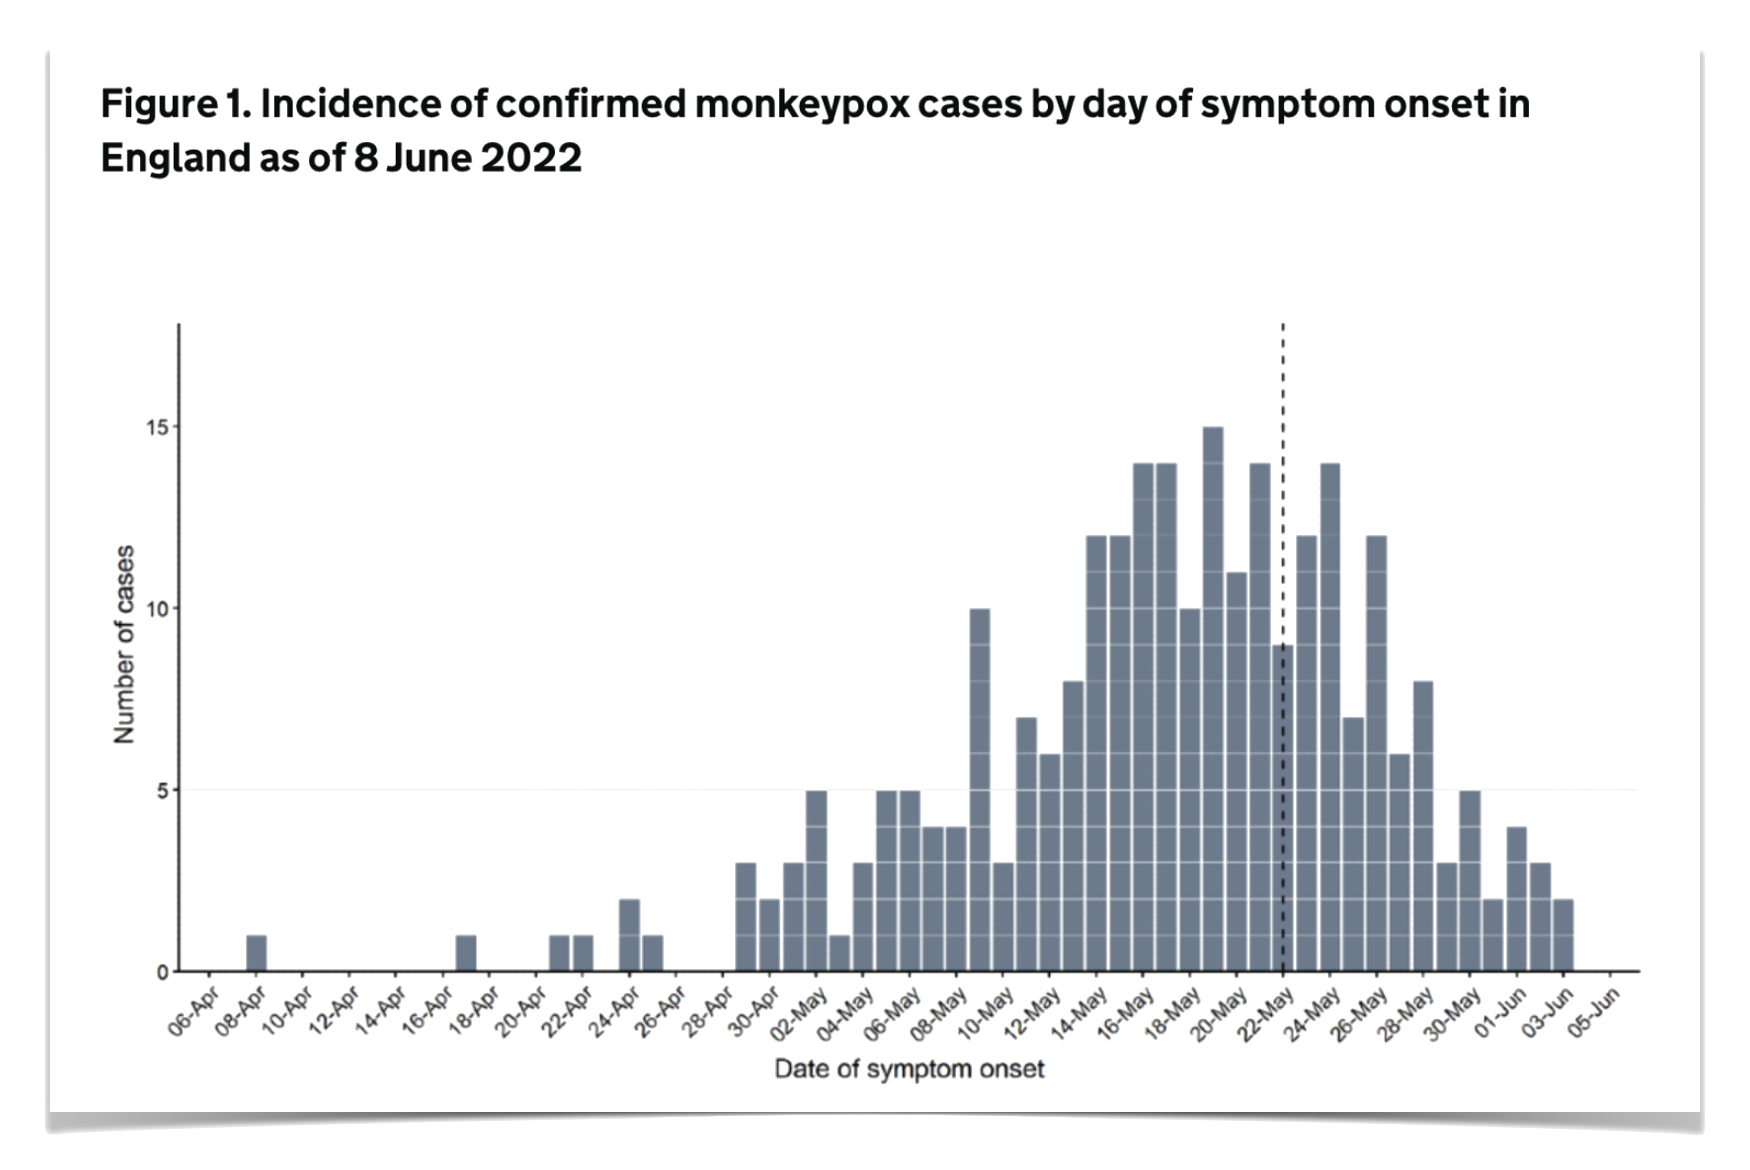
- what is the number of cases now?
- is it rising/falling and by how much?
- what does this mean for the near future?
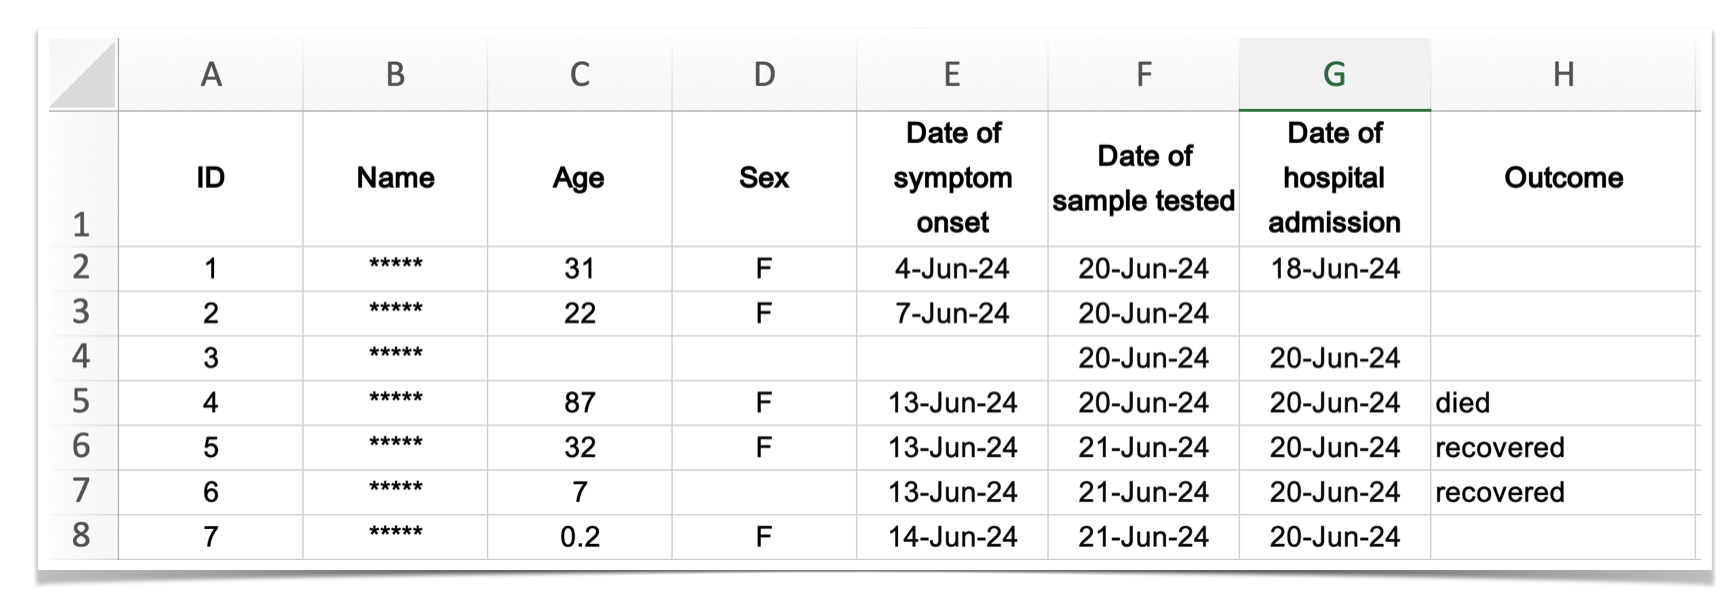
Data usually looks like this
![]()
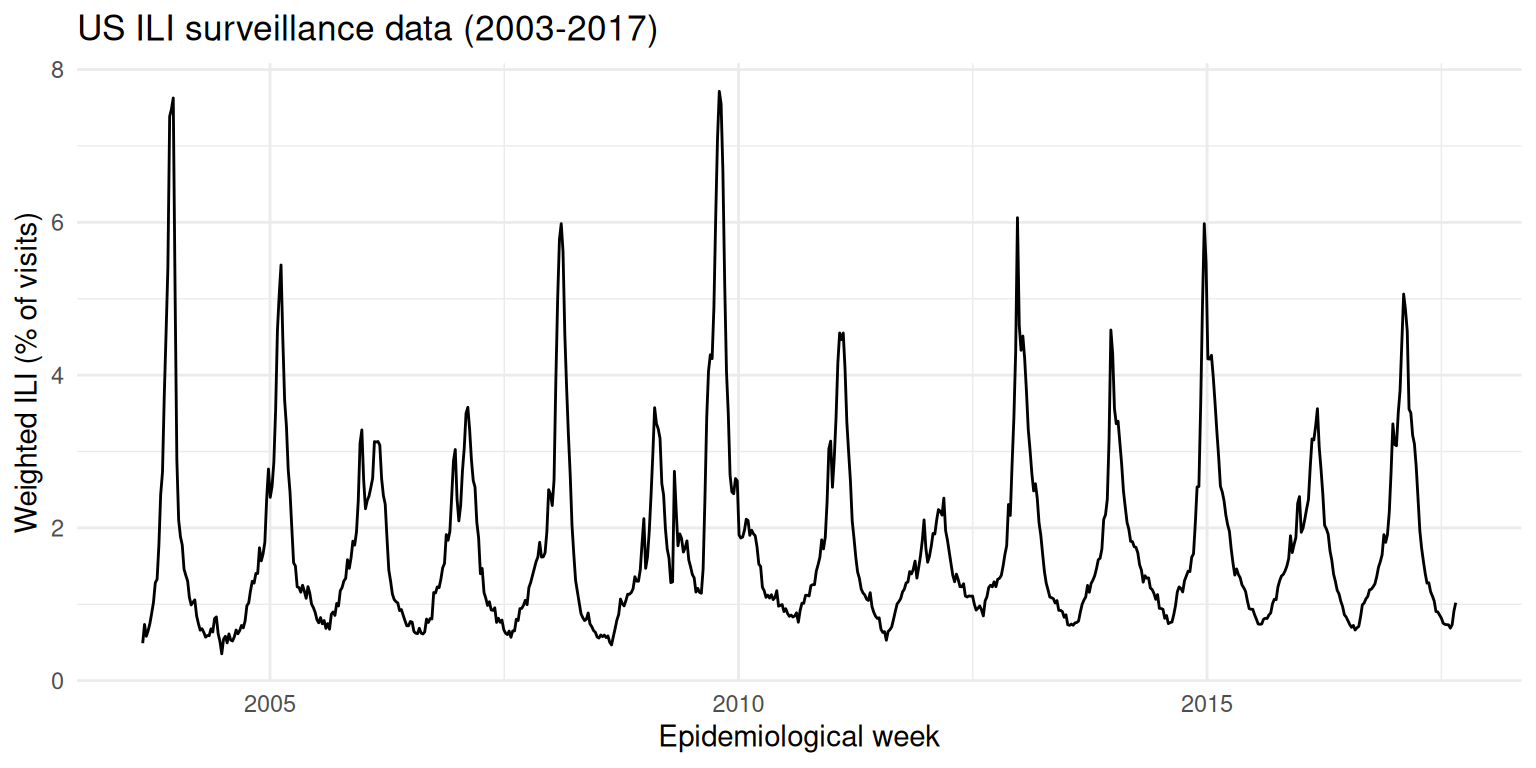
Sometimes we can only access proxy data
Influenza-like illness (ILI): fever AND additional “flu-like” symptom (cough, headache, sore throat, etc.)
- Used when direct case data isn’t available
- Measures % of outpatient visits due to ILI
![]()
Aim of this course:
How can we use data typically collected for other purposes to answer questions like
- what is the number of cases now? (nowcasting)
- is it rising/falling and by how much? (\(R_t\) estimation)
- what does this mean for the near future (forecasting)
in real time.
Approach
Throughout the course we will
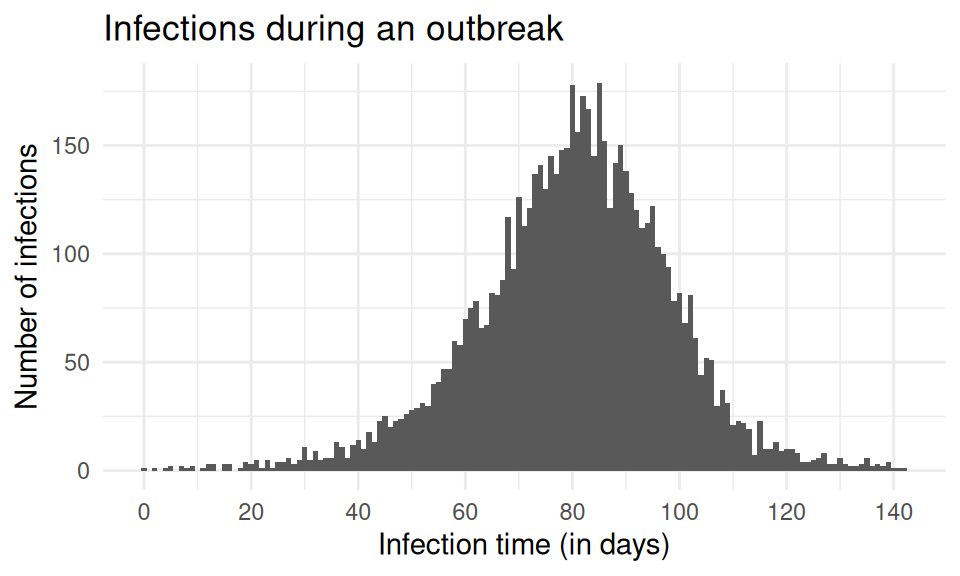
- use models to simulate data sets in R
(the generative model of the simulated data)
![]()
Approach
Throughout the course we will
- apply generative models to simulated data in Stan to
- learn about the system (conduct inference)
- make predictions (nowcasting/forecasting)
Approach
Throughout the course we will
- shift, in the second half, to demonstrations of data-driven forecasting and real-world applications
Approach
Throughout the course we will
- work through all steps of a forecasting pipeline of data exploration, model and experimental design, forecast evaluation and combination.
Timeline
- delay distributions and how to estimate them (day 1)
- \(R_t\) estimation and nowcasting (day 2)
- forecasting, evaluation, and ensemble methods (day 2)
- forecasting hubs, applications, and linking nowcasting and forecasting (day 3)