Forecasting practice and local hubs
Nowcasting and forecasting of infectious disease dynamics
Turned loose!
We’ve covered a ton of material on creating, visualizing, evaluating and ensembling forecasts.
Now it’s your turn to work more independently on these tasks in our “Sandbox Hub”.
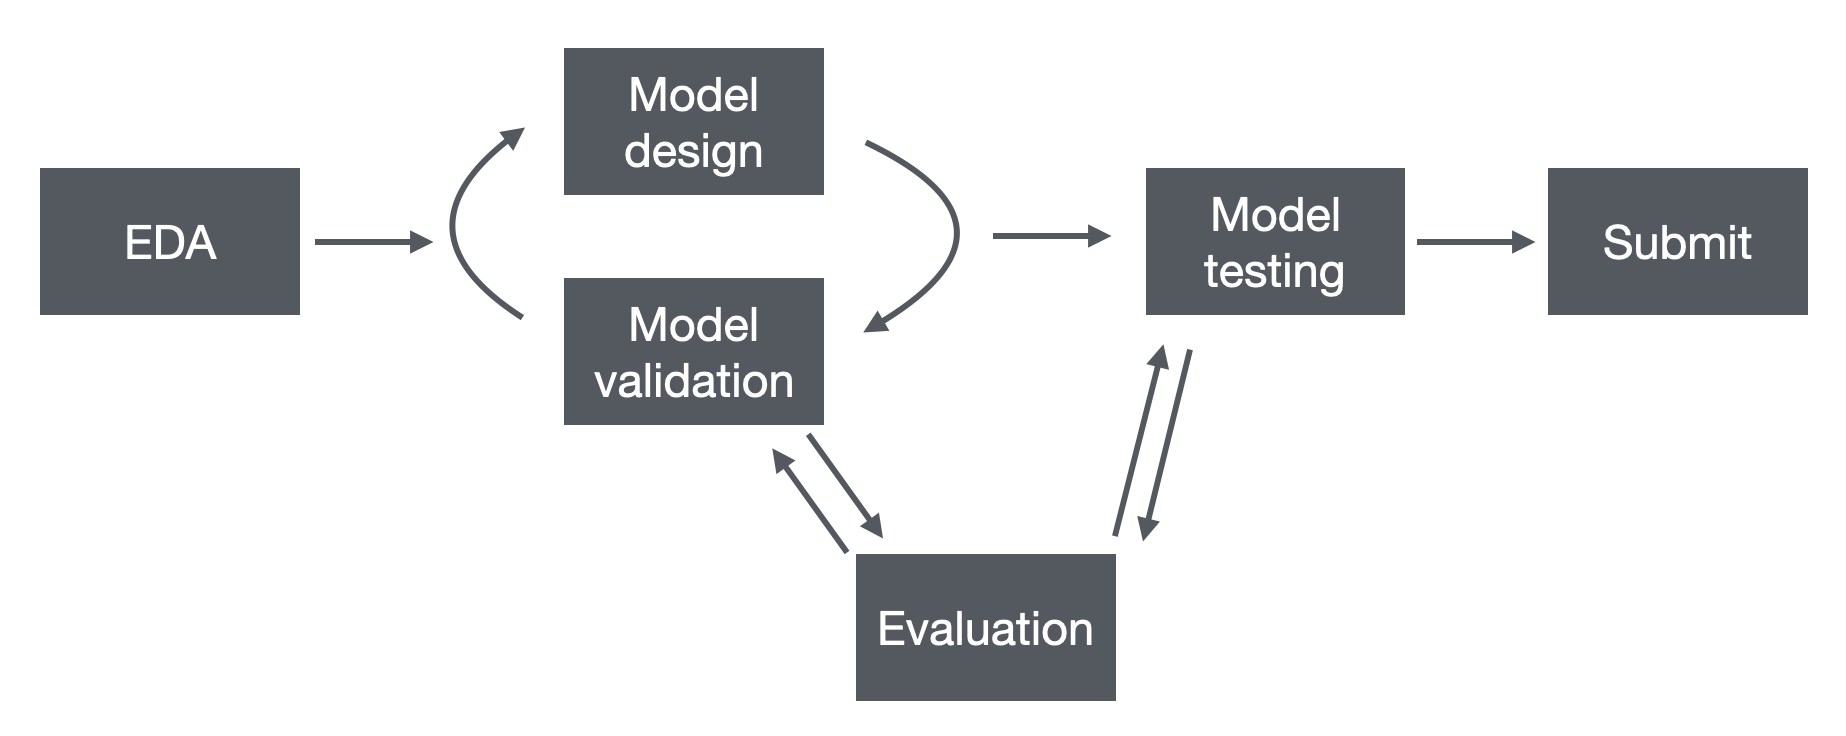
Model development workflow
Here is a summary of the forecasting workflow that we have covered in previous sessions:
![]()
Your Turn
- Clone the Sandbox Hub.
- Build and visualize forecasts from models that you are interested in.
- Validate and test forecasts.
- Submit forecasts to the Sandbox Hub.