Introduction to epidemiological delays
Nowcasting and forecasting of infectious disease dynamics
Epidemiological delay
Time between two epidemiological events
Epidemiological events: disease progression
- infection
- symptom onset
- becoming infectious
- hospital admission
- death
Epidemiological events: recovery
- pathogen clearance
- symptoms clearance
- end of infectiousness
- discharge from hospital
Epidemiological events: control
- quarantine
- isolation
- treatment
Epidemiological events: reporting
- specimen taken
- report added to database
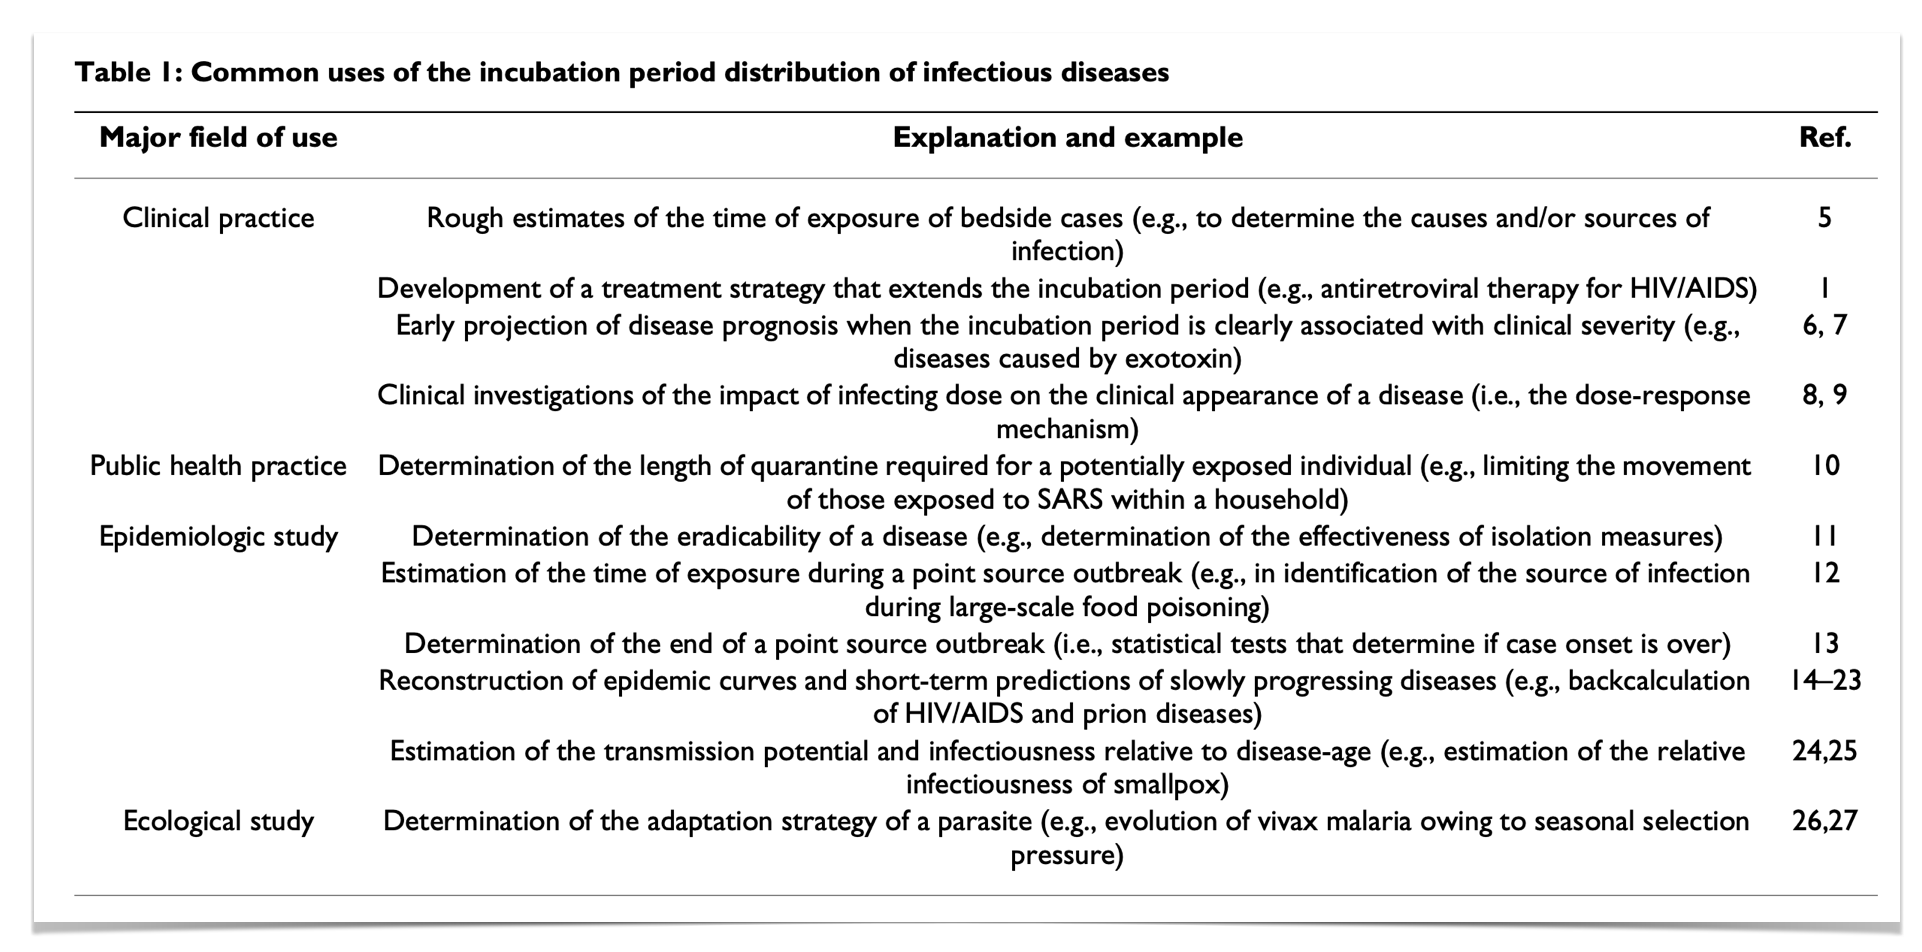
Some delays have names
infection to symptom onset
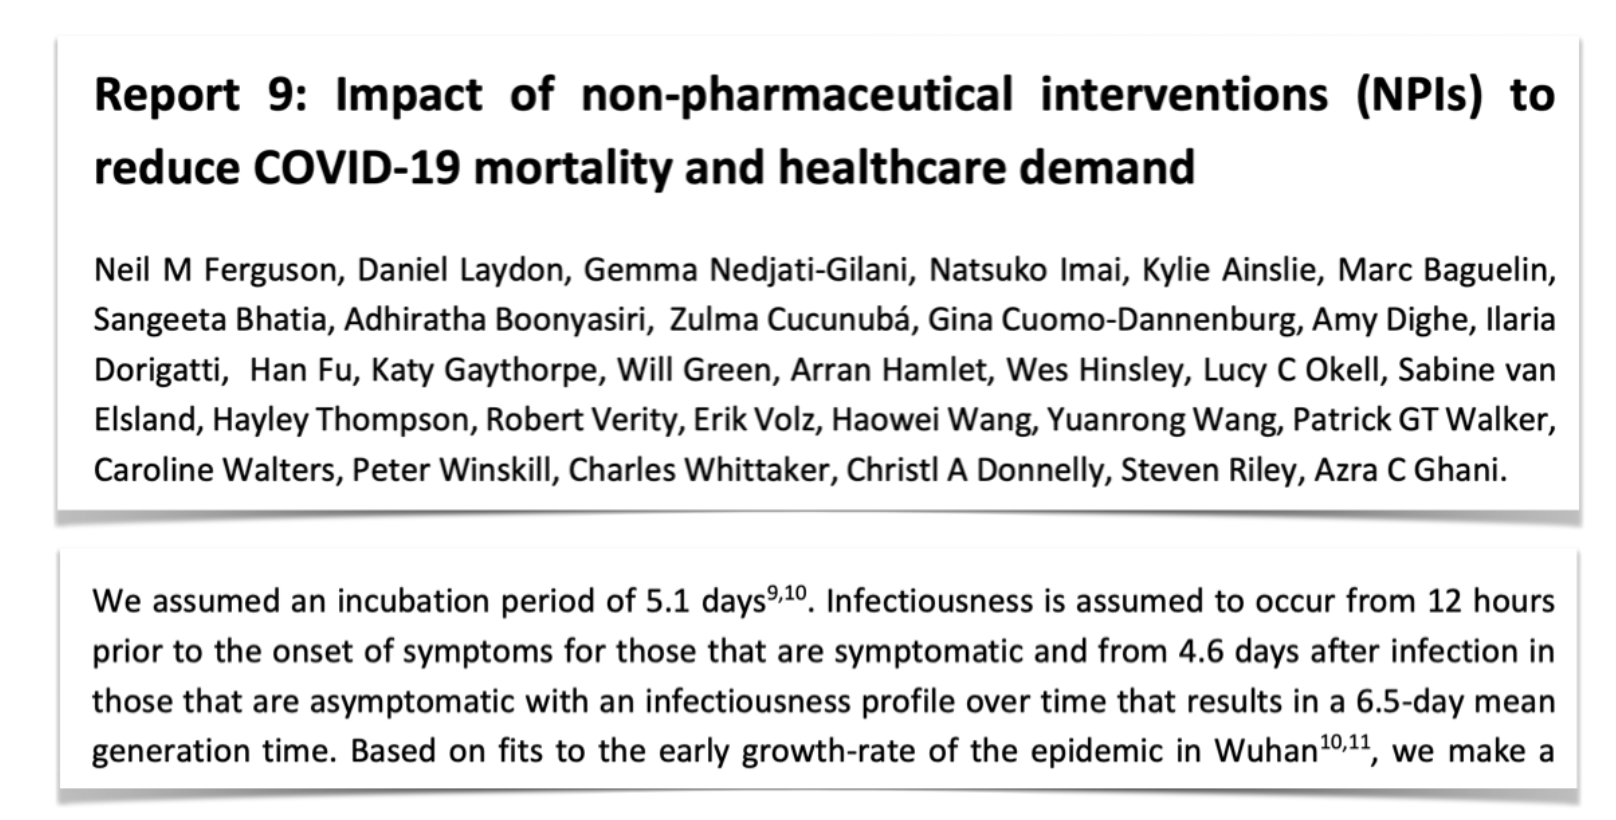
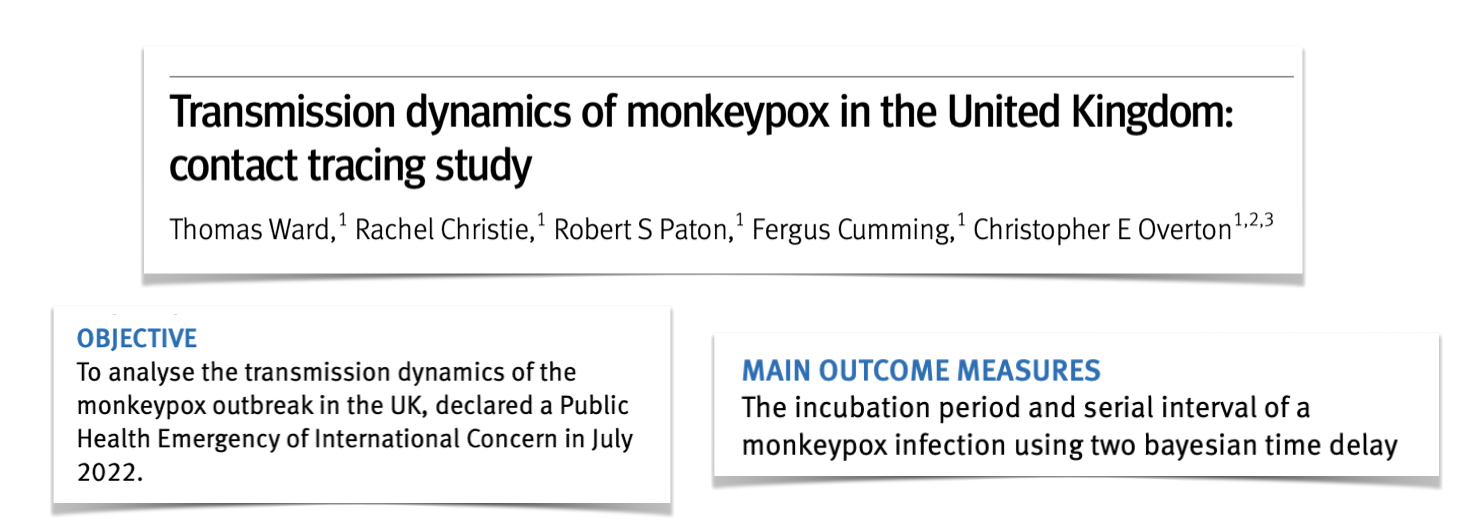
Incubation period
Some delays have names
infection to becoming infectious
Latent period
Some delays have names
becoming infectious to end of infectiousness
Infectious period
Some delays have names
hospital admission to discharge
Length of stay
Some delays have names
symptom onset (person A) to symptom onset (person B, infected by A)
Serial interval
Some delays have names
infection (person A) to infection (person B, infected by A)
Generation interval
Why do we want to know these?
Key parameters in mathematical models
Key parameters in mathematical models
Key elements of infectious disease epidemiology
Why do we want to know these?
Key elements of infectious disease epidemiology
Intricate relationship with nowcasting/forecasting
Quantifying delays
Epidemiological delays are variable between individuals
We can capture their variability using probability distributions
What is a probability distribution?
Mathematical way to describe variability in delays
Shows how likely different delay values are
Common examples for delays:
- Log-normal: right-skewed, good for incubation periods
- Gamma: flexible shape, alternative for delays
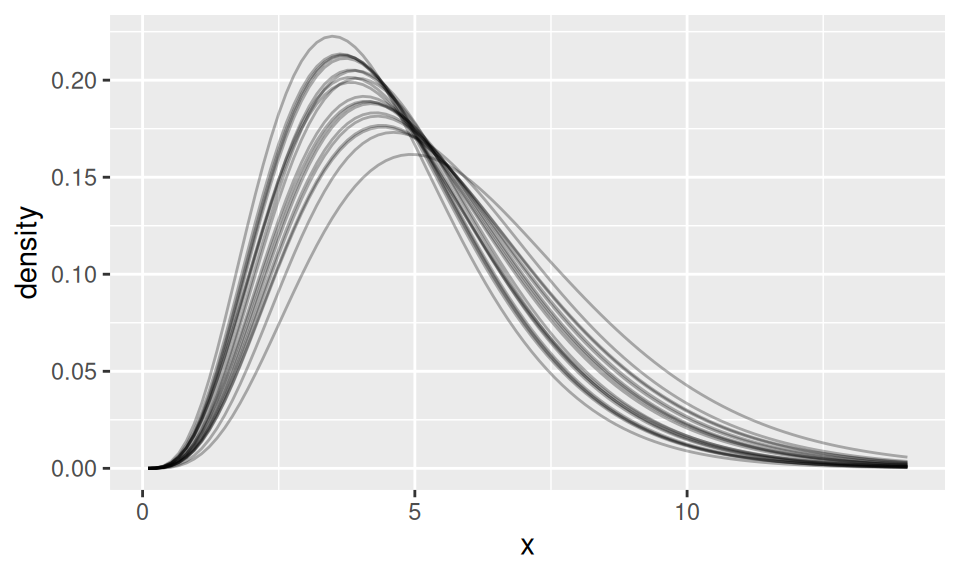
Warning: Two levels of uncertainty
- Probability distributions characterise variability in the delays between individuals
- Parameters of the probability distribution can be uncertain
\[ \alpha \sim \mathrm{Normal}(mean = 5, sd = 0.1) \\ \beta \sim \mathrm{Normal}(mean = 1, sd = 0.1) \\ \]
Showing probability density functions of lognormal distributions with shape \(\alpha\) and rate \(\beta\).
Statistical inference for delays
We observe delay data but don’t know true distribution parameters
Need to estimate parameters from incomplete, noisy data
Bayesian approach: prior knowledge + observed data → posterior estimates
Stan for delay estimation
Statistical software for Bayesian inference
We specify: data structure, parameters to estimate, model relationships
Stan returns parameter estimates with proper uncertainty quantification
Your Turn
- Simulate epidemiological delays
- Estimate parameters of a delay distribution
Introduction to epidemiological delays