Combining nowcasting and forecasting
Nowcasting and forecasting of infectious disease dynamics
Motivating example
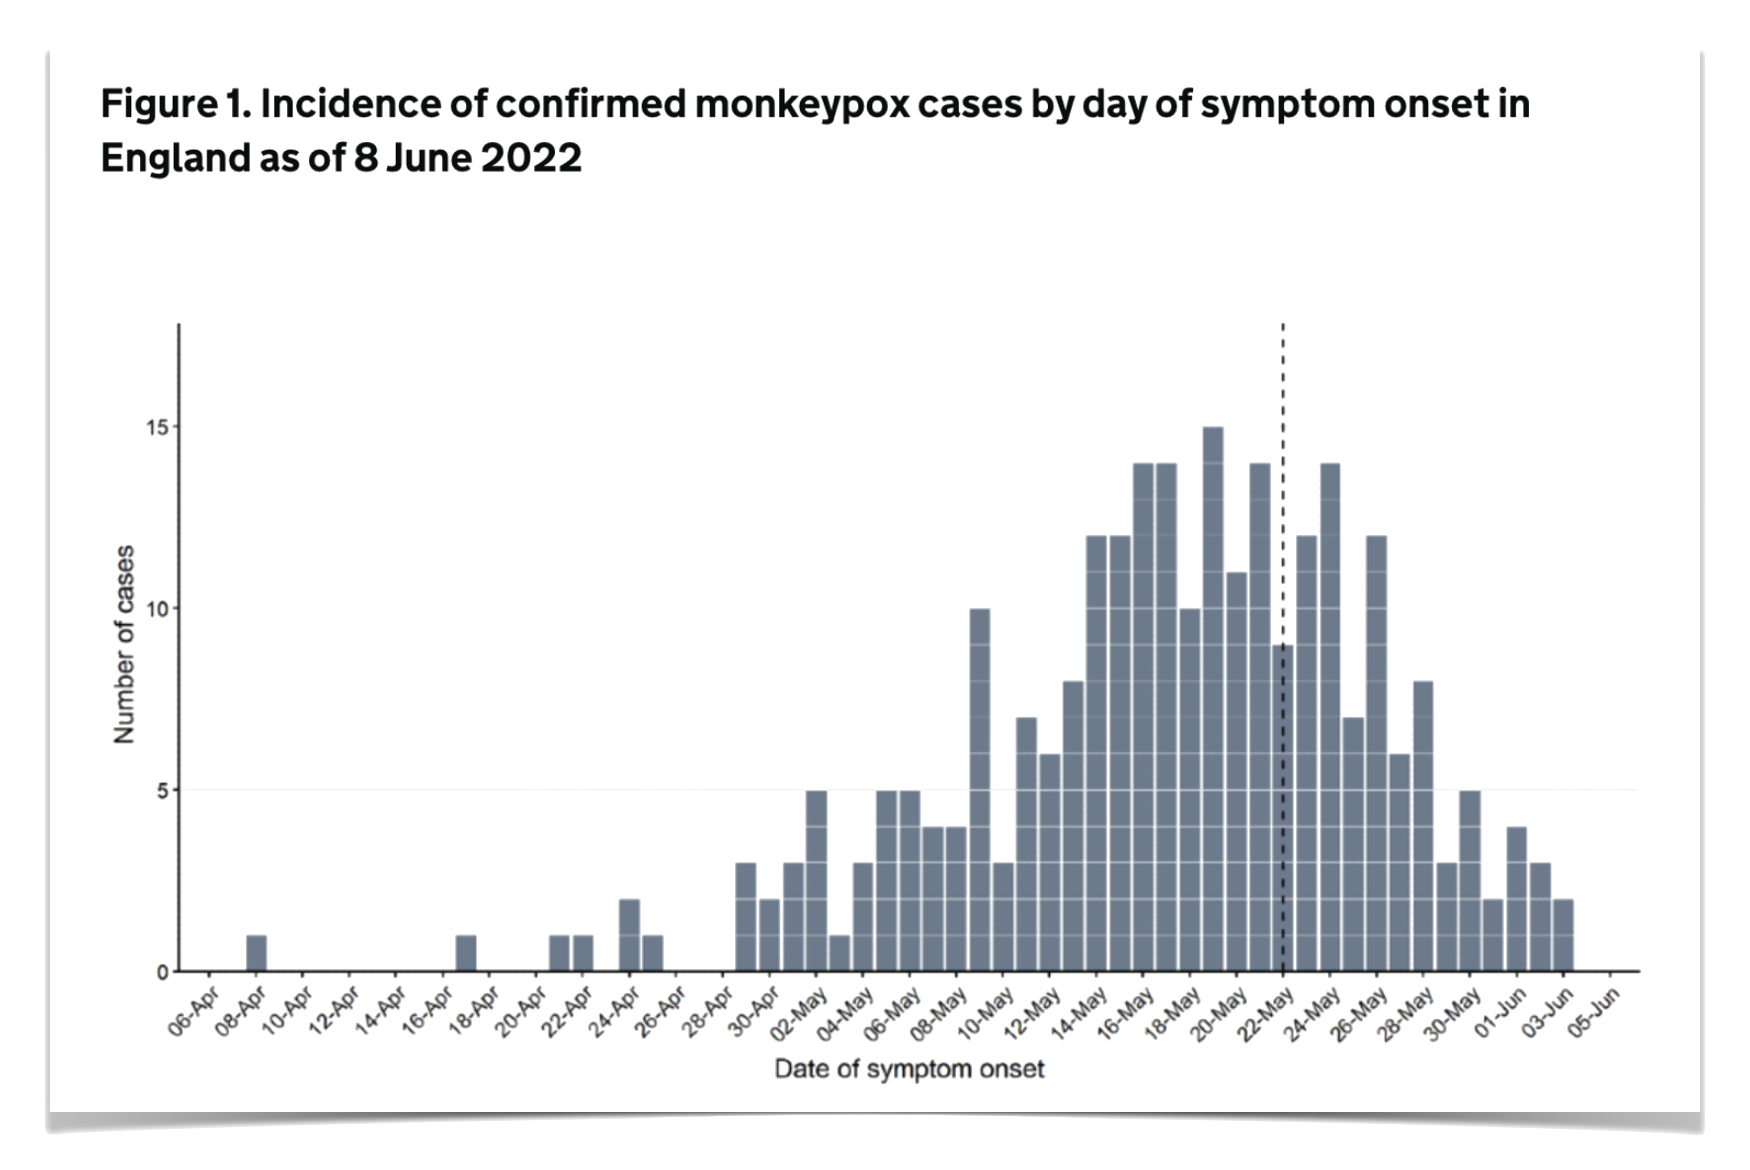
Often we want to forecast from data like this
![]()
Data after the dashed line are marked as uncertain. How can we use them for forecasting?
The problem: Forecasting with incomplete data
Traditional approach: Wait for “complete” data
- Might mean forecasting from 2+ weeks ago
- But as we’ve seen, forecasts after 2 weeks can be difficult
- Even our forecasts of “what is happening now” end up quite uncertain
The challenge:
- Reporting delays mean recent data are incomplete
- But we need forecasts based on the most recent information
- How do we bridge this gap?
Nowcasting reminder
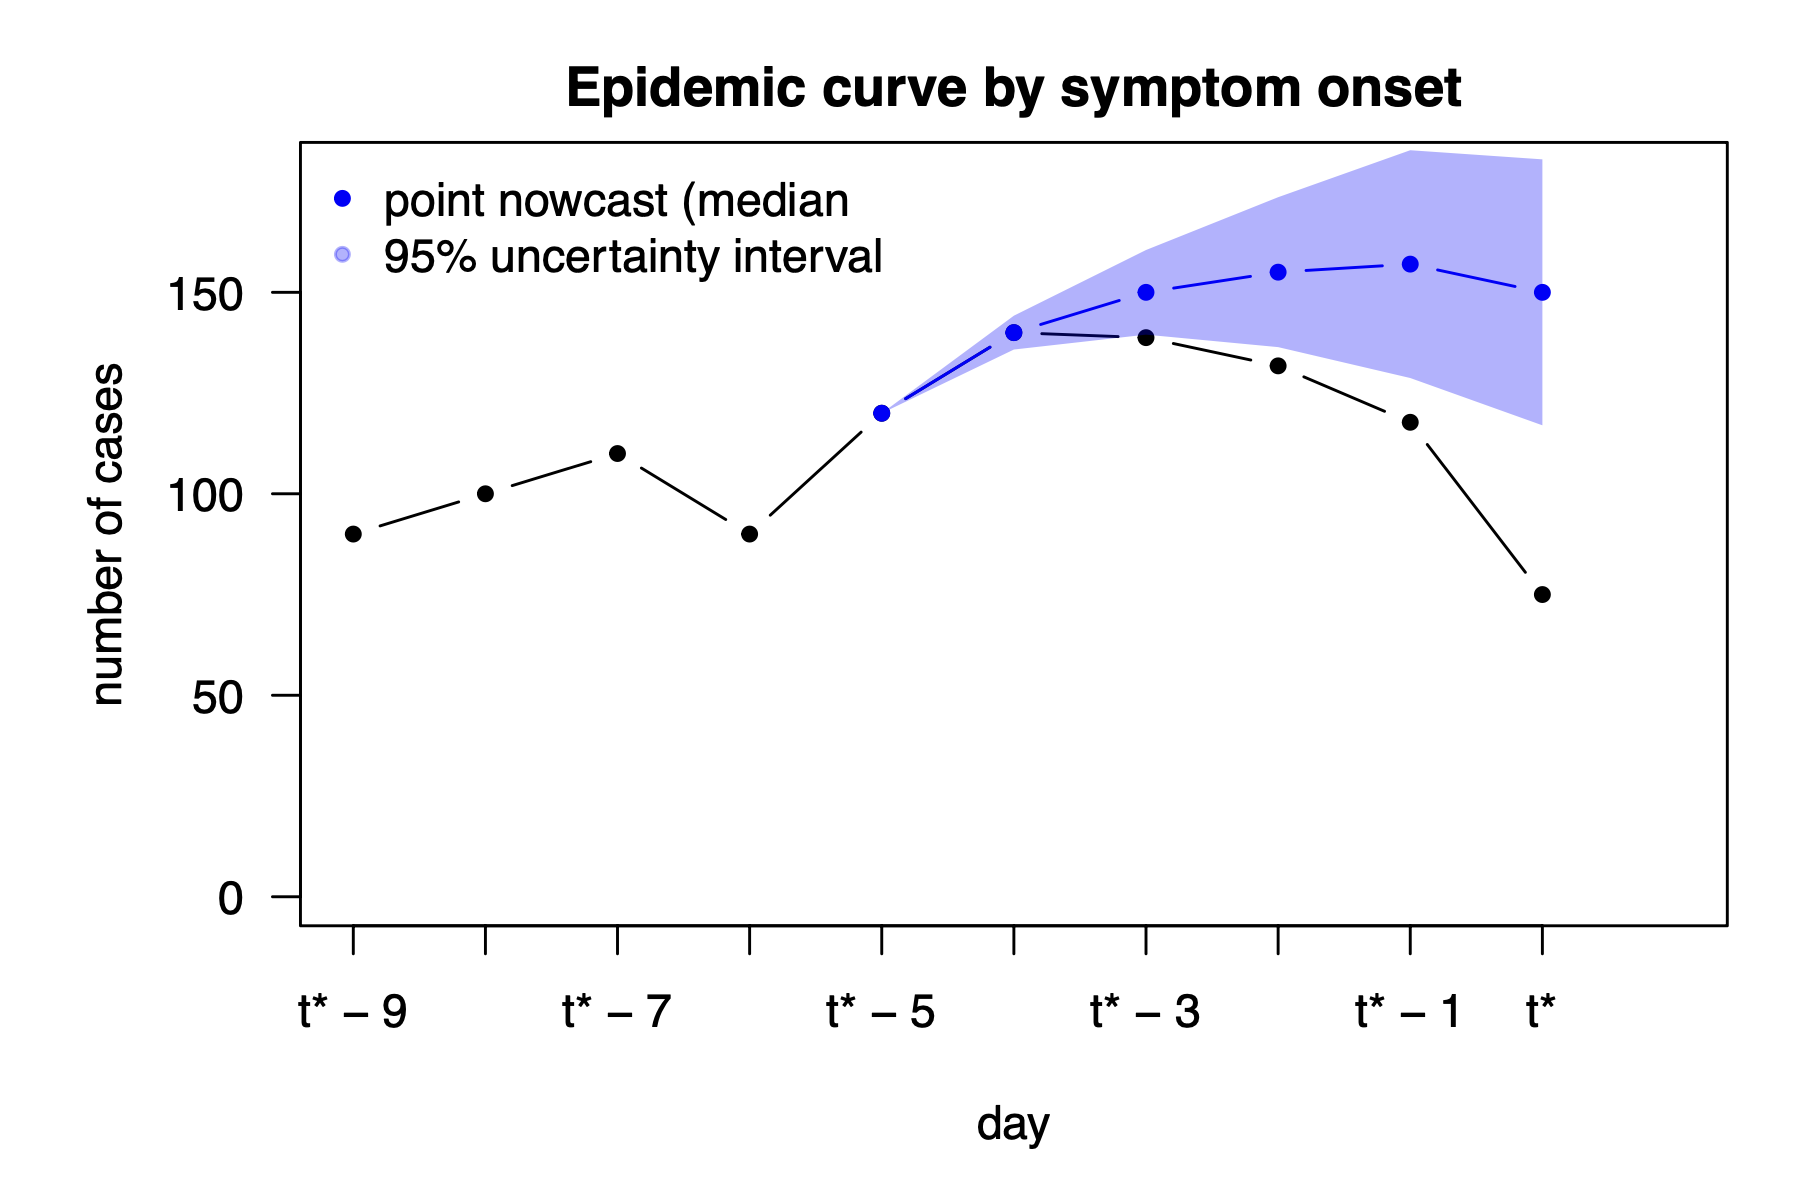
Predict what an epidemiological time series will look like after all delayed reports are in.
![]()
(slide courtesy of Johannes Bracher)
The nowcasting-forecasting continuum
Key insight: Nowcasting and forecasting aren’t distinct
- As we saw in the renewal session, even nowcasting \(R_t\) in real-time is partly a forecast
- Really we have a continuum of more or less information
- Some methods (e.g., Bayesian generative models) make this connection clear
- Others require more thought about how to link them
Approach 1: Complete data approach
- Filter to “complete” data only
- Standard forecast from truncated series
- Problem: Throws away recent information
Approach 2: Pipeline approach (point estimates)
- Point estimate correction for truncation
- Forecast from “adjusted” data
- Problem: No uncertainty propagation
Approach 3: Pipeline approach (with uncertainty)
- Sample from nowcast posterior
- Forecast from multiple trajectories
- Better: Some uncertainty propagation
- But: Still treating nowcast and forecast as separate steps
Approach 4: Joint approach
- Simultaneous nowcast and forecast
- Full Bayesian inference
- Advantage: Proper uncertainty quantification
- Trade-off: More complex to implement
Questions to consider
For each approach:
- How much data does it use?
- Where does uncertainty come from?
- What assumptions are we making?
- When might it work well or poorly?
Your Turn
- Generate example data with realistic truncation
- Implement 4 forecasting approaches (complete data, pipeline, joint)
- Compare performance quantitatively
- Discuss trade-offs and applications